Views
Views determine which project data is visible and how it is evaluated. Rillsoft Project connects scheduling, resource planning, capacity planning, and project controlling through several view types.
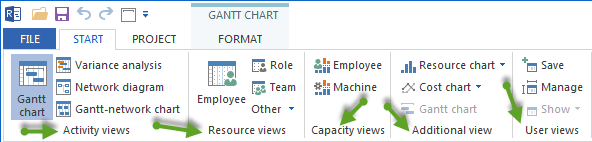
Activity Views
Activity views show dates, structures, and dependencies of activities and subprojects.
Gantt chart
The Gantt chart is the central view for scheduling and project control.
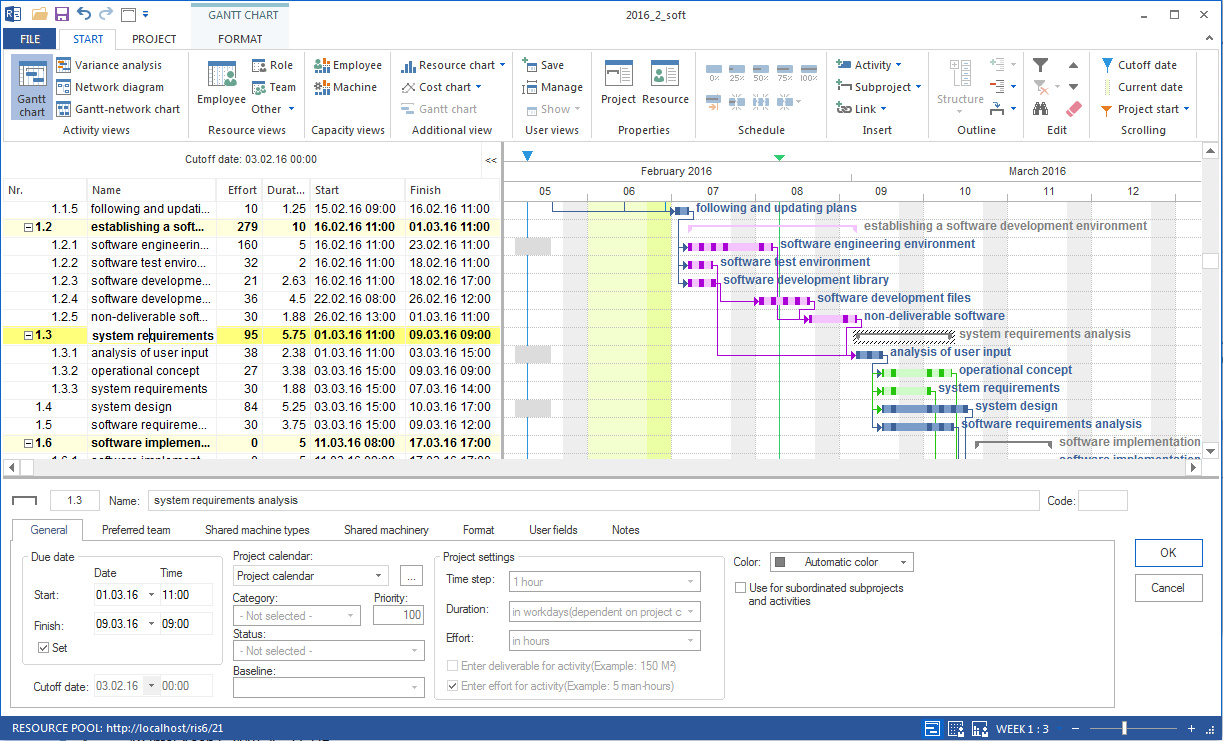
Areas of use:
visualise the schedule
display the project structure
check reserve times (buffers)
check resource utilisation with filter support
In the Gantt chart you can:
create and edit activities and subprojects
link activities (drag the arrow symbol at the bar end)
edit the project structure via Start > Outline (move activities into subprojects, show/hide detail)
change the timescale
open the context menu by right-clicking
Context menu — activity table
Right-click an activity in the activity table:
Command |
Meaning |
|---|---|
Cut |
Cut the selected activity. |
Copy |
Copy the selected activity. |
Adjust predecessor activities to the latest possible start date |
Move all activities before the selected activity to the latest possible start date. |
Adjust successor activities to the earliest possible start date |
Move all activities after the selected activity to the earliest possible start date. |
Completed |
Enter the degree of completion of the activity. |
Split |
Split the activity into several parts. |
Delete incoming/outgoing links |
Remove all links of the selected activity. |
Right-click a subproject in the activity table:
Command |
Meaning |
|---|---|
Cut / Copy |
Cut or copy the subproject. |
Show / Hide |
Show or hide the detail depth of the subproject down to any outline level. |
Adopt start and finish dates from activities |
Set the subproject start to the start date of the first activity and the subproject finish to the finish date of the last activity. |
Set earliest possible start dates |
Move all activities in the subproject to the earliest possible start dates (only active with a fixed start and finish date). |
Set latest possible start dates |
Move all activities in the subproject to the latest possible start dates (only active with a fixed start and finish date). |
Move delayed activities to the cut-off date |
Move not-yet-completed activities that lie before the cut-off line to the cut-off date. |
Optimise resource utilisation |
Calculate an optimal assignment distribution to minimise over- and under-utilisation in the given period. |
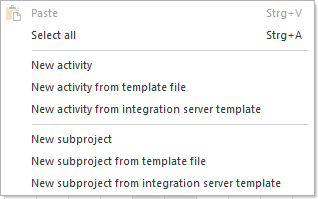
Context menu — chart area
Right-click the empty area of the Gantt chart:
Command |
Meaning |
|---|---|
Insert |
Insert cut or copied activities / subprojects. |
Select all |
Select all activities and subprojects. |
New activity |
Create a new activity at the cursor position. |
New activity from file template |
Insert a saved file template at the cursor position. |
New activity from Integration Server template |
Insert an Integration Server template (only when connected to the Rillsoft Integration Server). |
New subproject |
Create a new subproject at the cursor position. |
New subproject from file template |
Insert a saved subproject template. |
New subproject from Integration Server template |
Insert an Integration Server template for subprojects (only with Integration Server). |
Network diagram
The network diagram shows the technological dependencies between activities as a node diagram.
Areas of use:
display the logical structure and dependencies without a timescale
visualise the critical path and buffers
edit links directly
In the network diagram you can create and edit activities and subprojects and link activities. The subproject and chart-area context menus offer the same commands as in the Gantt chart.
Gantt-network chart
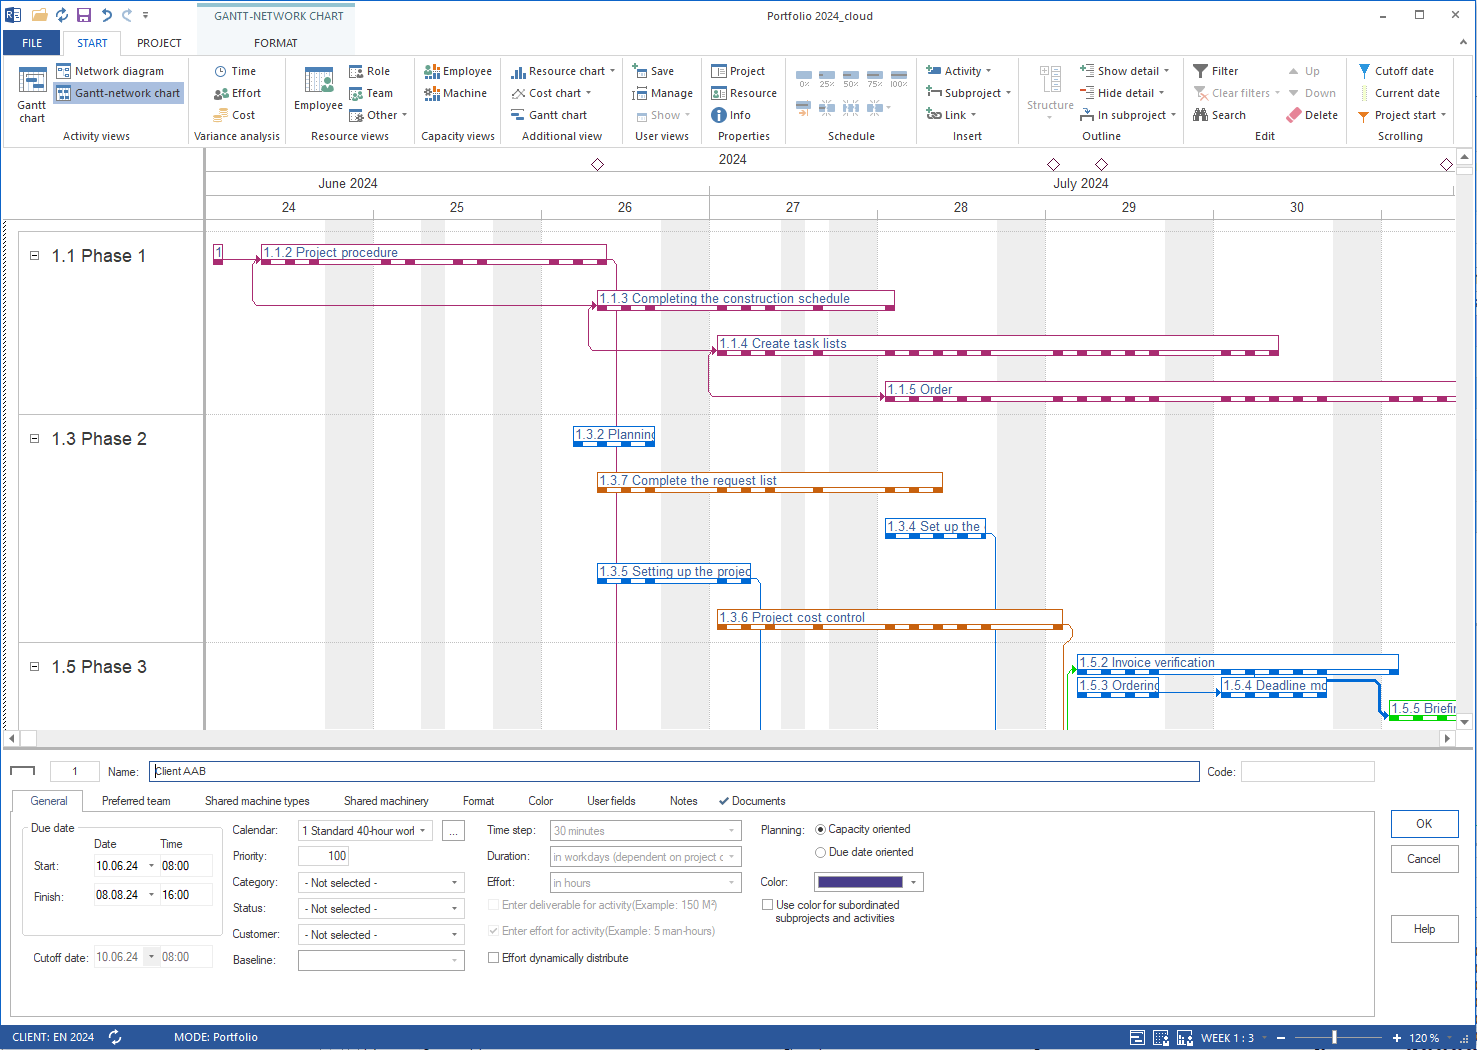
The Gantt-network chart combines the time axis of the Gantt chart with the link arrows of the network diagram.
Areas of use:
make the time position and dependencies visible at the same time
highlight the critical path
Variance analysis (target/actual comparison)
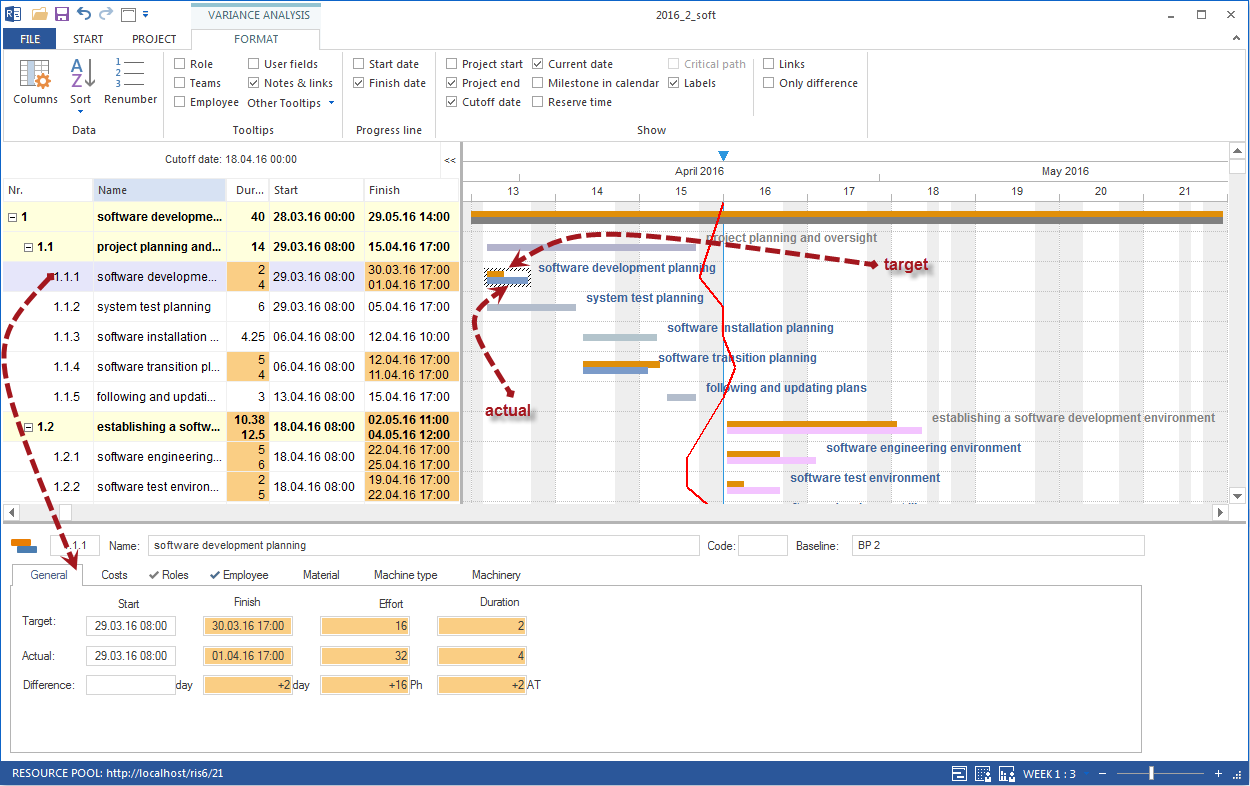
The target/actual views overlay the current plan with the saved baseline and show time, effort, and cost deviations. Full reference: Target/Actual Comparison Views.
Resource Views
Resource views show the utilisation and assignment of all resource types.
Personnel — utilisation of individual employees
Roles — demand and coverage by professional qualification
Team — team utilisation
Material demand — consumption of material resources
Machine types — utilisation per machine type
Machine park — utilisation of individual machines
Full reference: Resource View Variants.
Capacity Views
Capacity views compare demand (roles) with available capacity.
Capacity balancing personnel — coverage check per qualification
Capacity balancing machines — coverage check for equipment
Role utilisation — standard view and variants (effort, FTE, per project)
Team utilisation — standard and per project
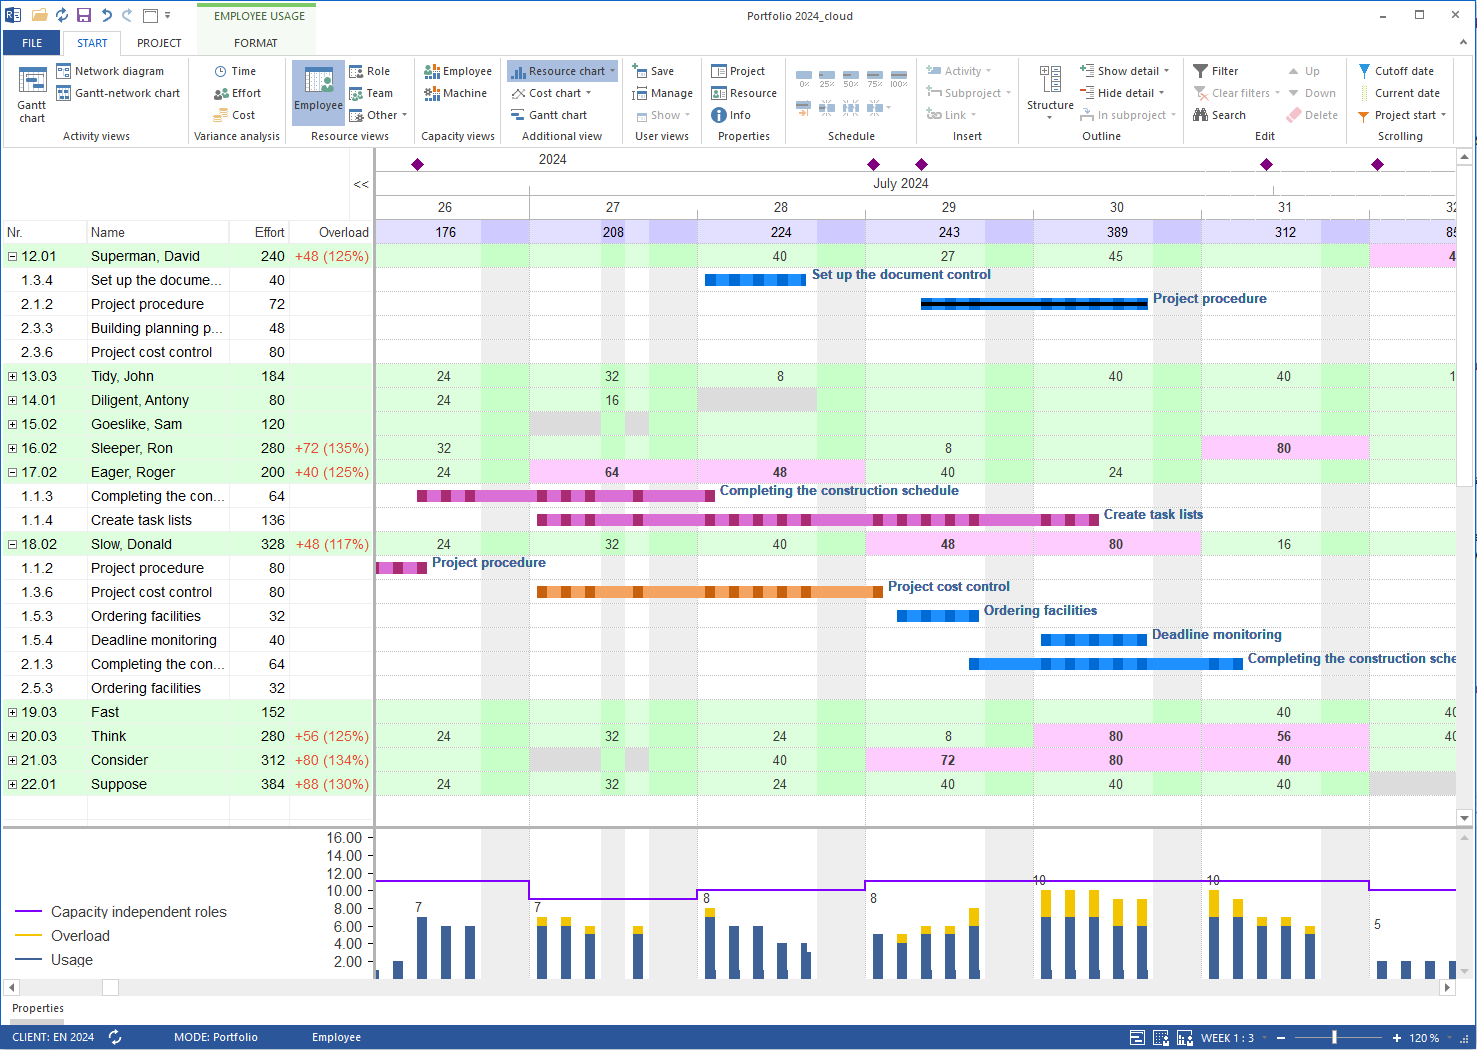
Employee utilisation by project
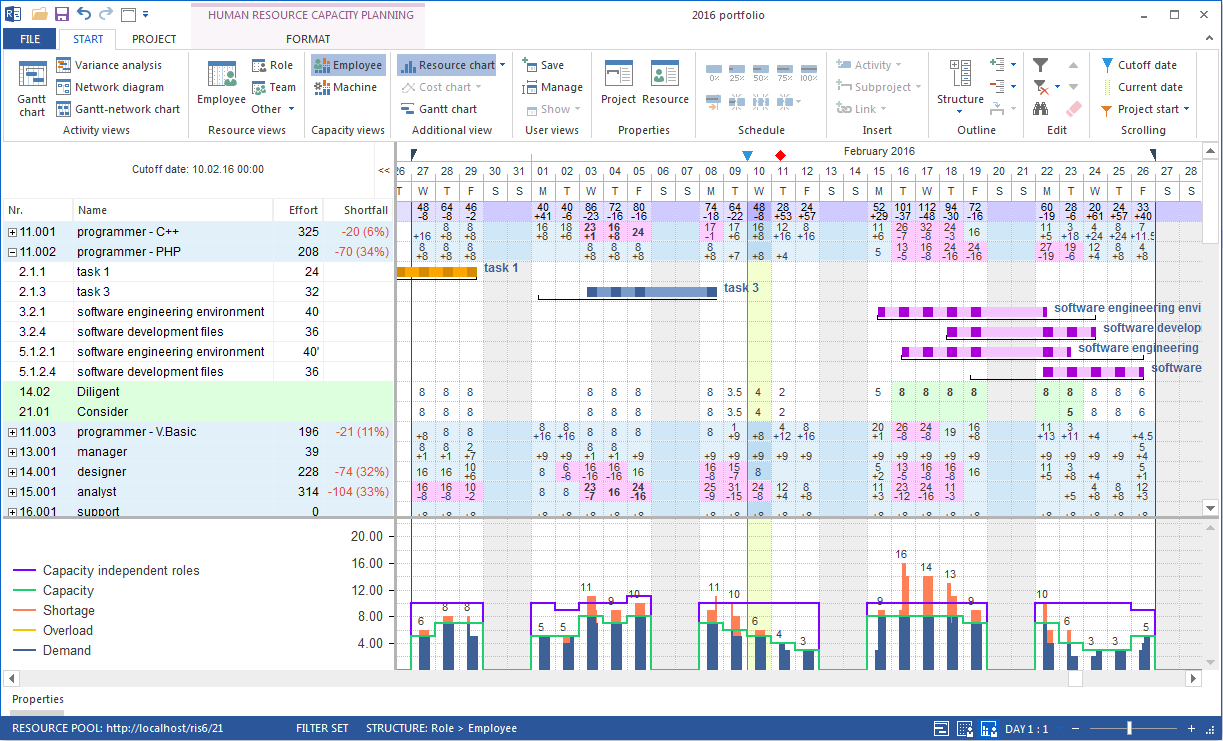
Full reference: Capacity View Variants.
Portfolio Views
In the project portfolio, the same views as in a single project are available: Gantt chart, capacity balancing, role utilisation, personnel, target/actual comparison.
In addition, the portfolio overview shows a compact status of all portfolio projects with dates, progress, and resource status. Full reference: Portfolio View.
Structure And Filter
Many views can be structured and filtered:
Structure (Start > Outline > Structure): group the view by criteria such as project, role, team, personnel, machine type, or category.
Filter: restrict the view to specific resources, periods, or status.
Timescale: choose the granularity (day, week, month, quarter).
Full reference: Customize Views: Filters, Format, Custom Views.