Customize Views: Filters, Format, Custom Views
This page describes how views in Rillsoft Project are filtered, formatted, combined with additional diagrams, and saved as custom views.
Filters
Filters control which activities, subprojects, and resources are visible in a view. The filter is opened via Start > Edit > Filter.
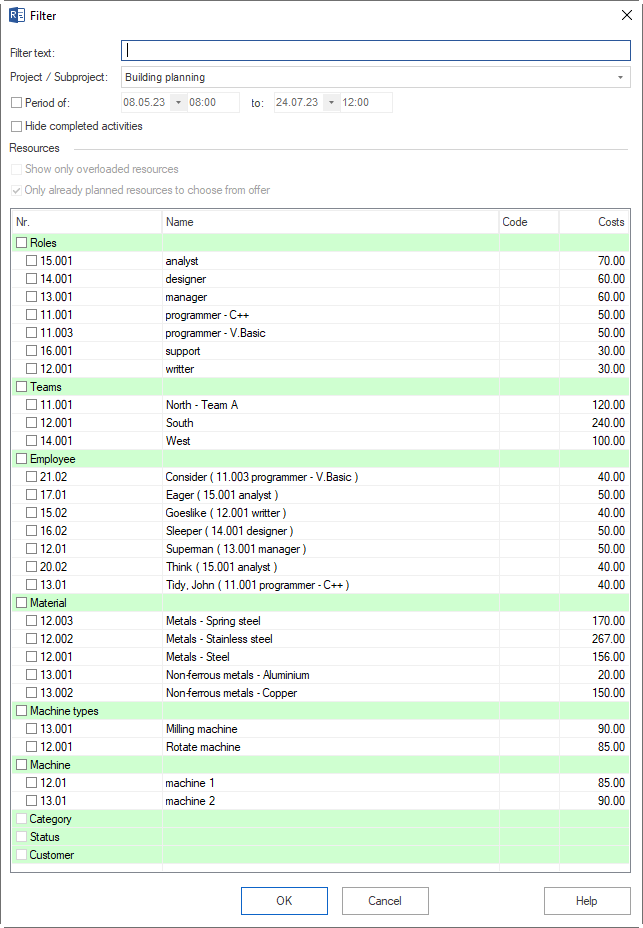
Select the desired filter options in the dialog and confirm with OK.
Free-text filter
Filters all views (except network diagram / bar network diagram) by:
activity and subproject names
code
user-defined fields
notes
Search criteria can be combined, for example activity name and notes at the same time.
Structure filter (project / subproject filter)
Shows activities and resources only for specific projects or subprojects. Usable in all views when subprojects are defined.
Reporting period filter (time filter)
Restricts the display to a specific period. Usable in: Gantt chart, target/actual comparison views, all resource views.
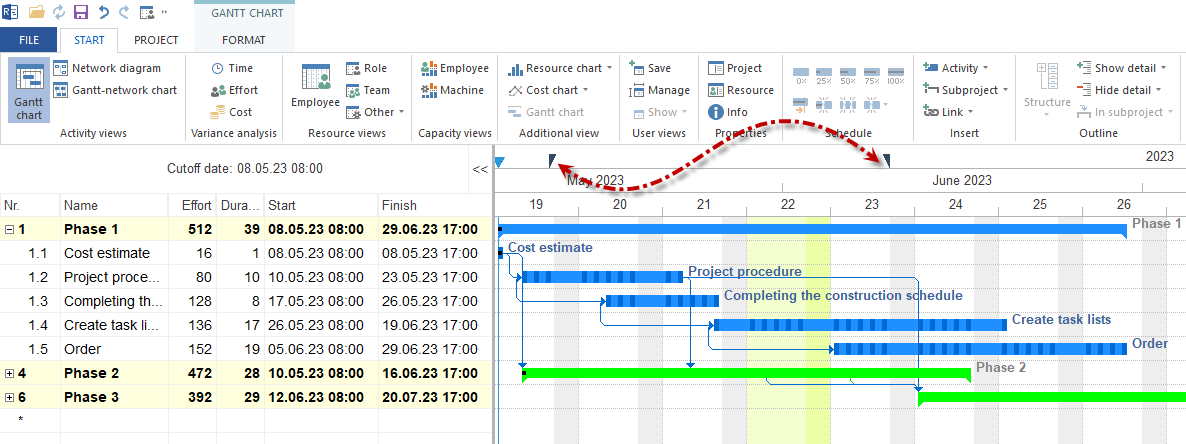
Alternatively: drag a period on the timescale with the left mouse button.
Hide completed activities
Hides finished activities. Usable in: bar chart, resource views.
In capacity views this filter causes resources from completed activities to be counted as free capacity.
Resource filter
Filter |
Usable in |
|---|---|
Show only overloaded resources |
Resource views Personnel, Machine park |
Offer only already planned resources for selection |
Role utilisation, team utilisation, employee utilisation, capacity balancing personnel, material, machine types, machine park, capacity balancing machines |
Note
In capacity views this filter refers primarily to roles. When the option is enabled, only roles that are already scheduled in the project or portfolio are shown.
Resource type filter
Filter |
Usable in |
|---|---|
Role filter |
Bar chart, role utilisation |
Team filter |
Bar chart, team utilisation |
Employee filter |
Bar chart, resource views, capacity views |
Material filter |
Bar chart, material demand |
Machine type filter |
Bar chart, machine types view |
Machine park filter |
Bar chart, machine park view |
Project master data filter
Filter |
Usable in |
|---|---|
Project categories |
Bar chart, resource and capacity views (portfolio) |
Project status |
Bar chart, resource and capacity views (portfolio) |
Project customers |
Bar chart, resource and capacity views (portfolio) |
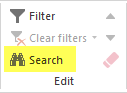
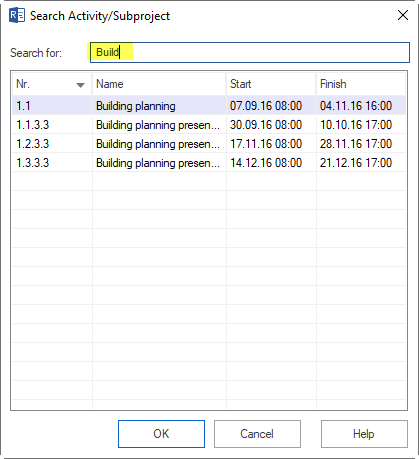
Search
The search is opened via Start > Edit > Search.
In the Search dialog you can define criteria for the following fields:
activity and subproject names
code
user-defined fields
notes
Search criteria can be combined. Unlike the free-text filter, the search shows hits individually and jumps to each hit in the view.
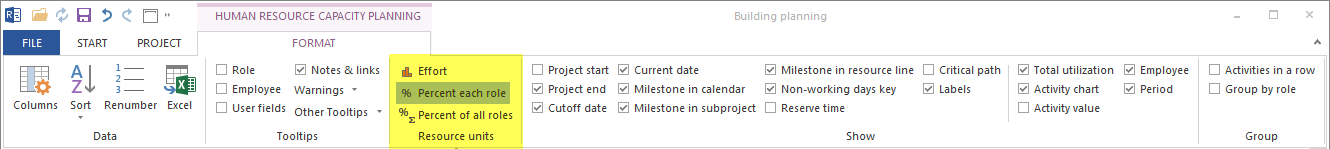
Format Tab
Every view contains a Format tab in the ribbon with view-specific display options.
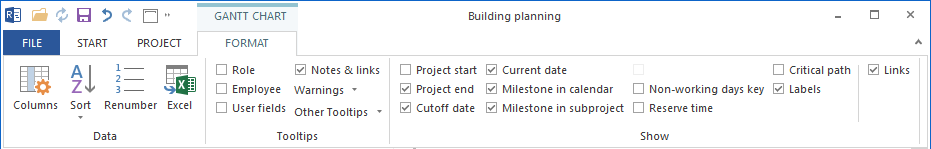
Data block
Option |
Function |
|---|---|
Columns |
Adjust the column arrangement in the activity table |
Sort |
Sort the order of activities by start time, name, and so on |
Number |
Renumber activities and subprojects after plan editing |
Excel |
Export the current view with outline levels to MS Excel |
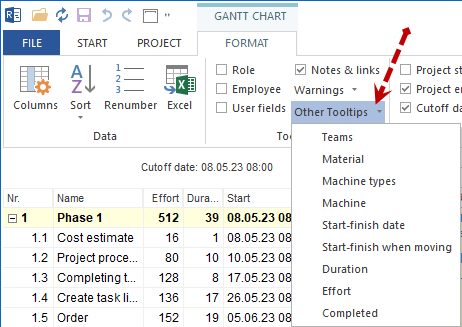
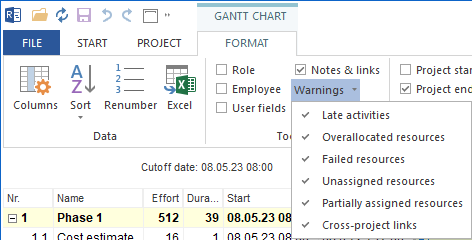
Tooltips block
Selected options appear as a tooltip or warning when the cursor is moved over an activity bar.
Available tooltips: Roles, Personnel, User-defined fields, Notes & Links, Other tooltips.
Display block (for all views except network diagram and bar network diagram)
Option |
Effect |
|---|---|
Project start |
Vertical line at the project start in the Gantt chart |
Project finish |
Vertical line at the project finish |
Cut-off date |
Vertical line at the cut-off date |
Current date |
Background colour for the area of the current date |
Milestone in calendar |
Show/hide milestones in the calendar bar |
Milestone in subproject/project |
Milestones on collapsed subproject bars |
Non-working days abbreviation |
Abbreviation for non-working days (for example V for vacation) in the chart |
Reserve time |
Earliest and latest possible activity positions |
Critical path |
Activities of the critical path in red |
Labels |
Show/hide bar labels |
Links |
Show/hide link lines between activities |
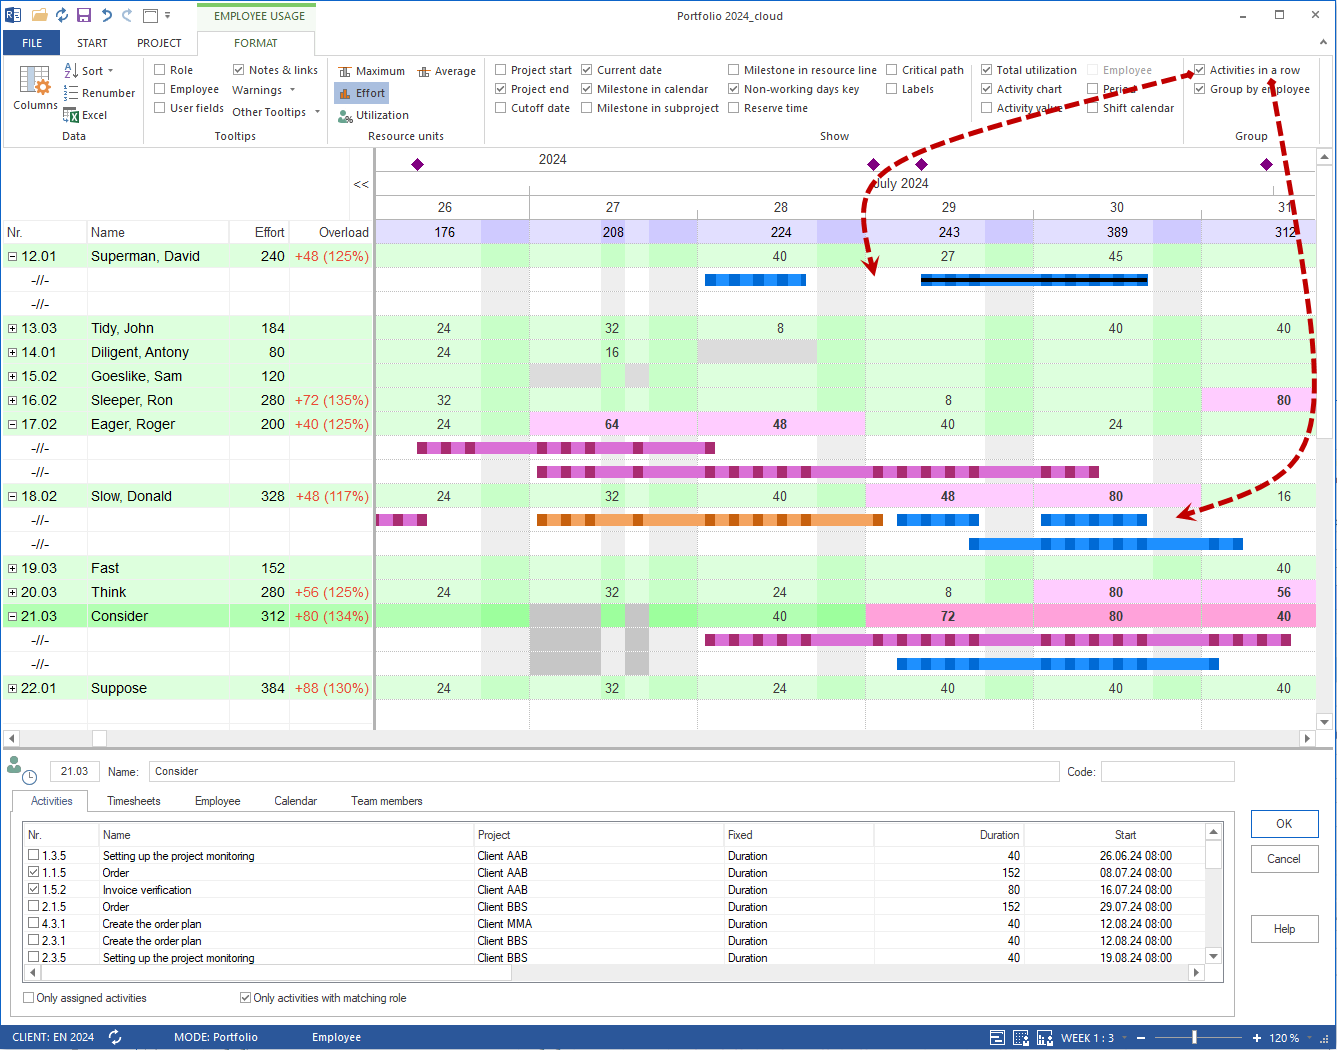
Display block (for resource views)
Option |
Effect |
|---|---|
Milestone in resource row |
Show milestones on collapsed resource rows |
Total utilisation |
Summed utilisation per view in the title area of the chart |
Activity bars |
Show activity bars in resource views |
Activity figures |
Show resource effort per activity |
Personnel |
Make employees visible in a capacity view |
Period |
Show free time windows in which activities can be moved |
Display block (specific to the Personnel view)
Shift calendar — show the shift calendar of the employees with a background colour
Display block (specific to target/actual comparison Time)
Difference only — show only activities and subprojects that deviate from the baseline
Display block (specific to target/actual comparison Effort/Costs)
Completed only — compare only effort or cost values for activities with achieved progress
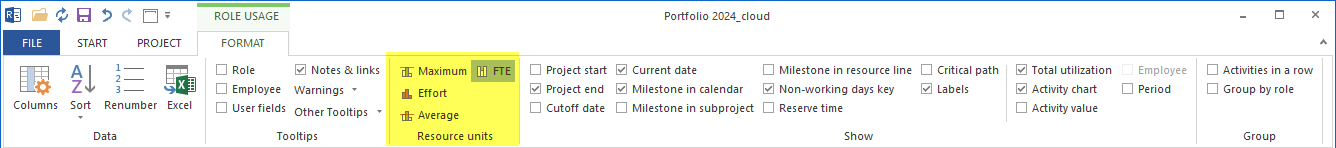
Resource units block (for personnel utilisation)
Option |
Display |
|---|---|
Maximum |
Maximum personnel resources required per time unit |
Average |
Average personnel resources required per time unit |
Effort |
Planned effort in person hours or person days |
Utilisation (percent) |
Total utilisation of the employees in percent per time unit |
For role utilisation the option FTE is additionally available: full-time equivalent as a share of the annual working time.
Resource units block (for capacity balancing personnel)
Effort — demand in person hours/days versus supply
Percentage per role — degree of coverage of a qualification in percent
Percentage of all roles — share of a qualification in the total demand
Target/actual comparison block (progress line, Time only)
Start dates — progress line at the start dates of the activities
Finish dates — progress line at the finish dates of the activities
Target/actual comparison block (difference, for Effort and Costs)
Value — baseline value and current value side by side
Difference — baseline value and deviation
Group block
Activities in one row — compressed display, useful with many activities
Group by personnel — combines all activities of an employee, even with several qualifications or team memberships
Custom Views
You can save a configured view including timescale, filter, and additional diagram as a custom view and call it up directly later.
Save a view
Configure a view with the desired settings (timescale, filter, additional diagram, format).
Click Start > User views > Add.

Enter a name for the view.
Choose:
Save as new view — creates a new custom view
Update current view — updates an already saved view
Confirm with OK.
Call up a view
Click Start > User views > Show and select the desired view.
Manage views
Click Start > User views > Manage. In the dialog you can:
change the order of the user views
edit names
delete user views