Capacity View Variants
Rillsoft Project provides several capacity views for employees and machinery. Each capacity view can also be extended with an additional chart. This article describes the variants and explains when each one is useful.
Employee Variants
All employee variants show capacity balancing between planned resource demand (roles or qualifications) and available resource supply (employees with matching qualifications).
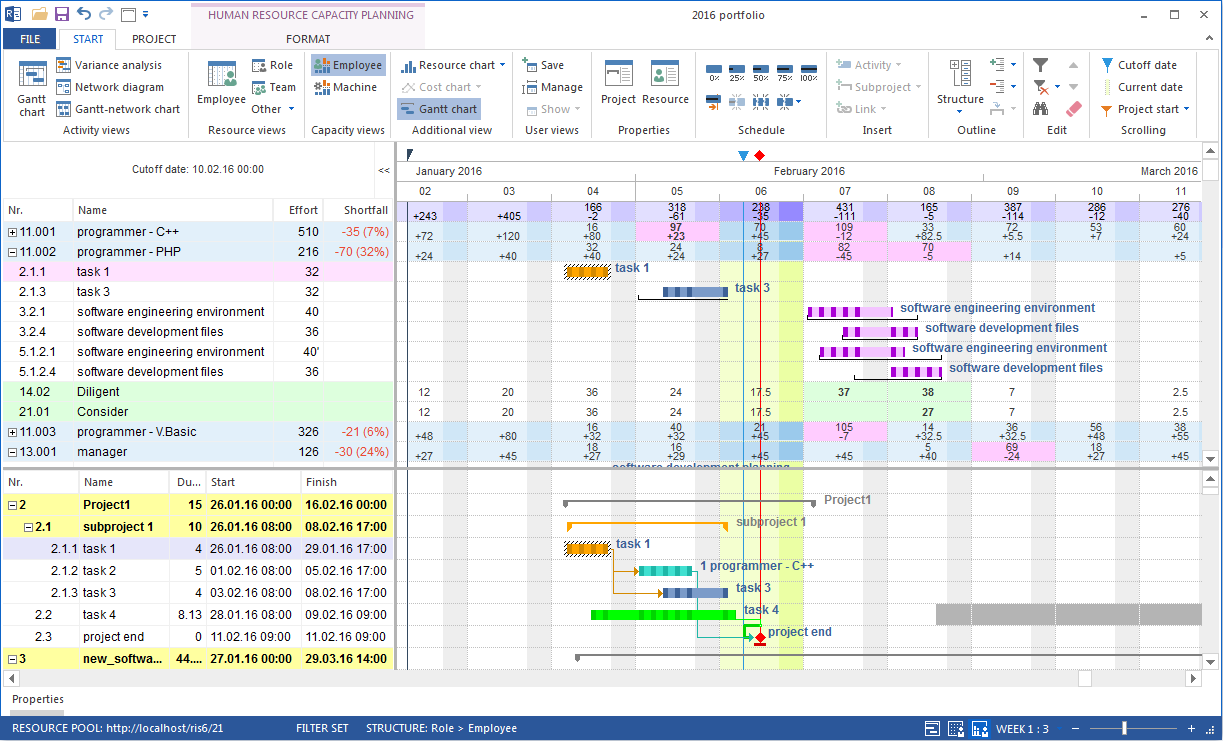
Human Resource Capacity Balancing
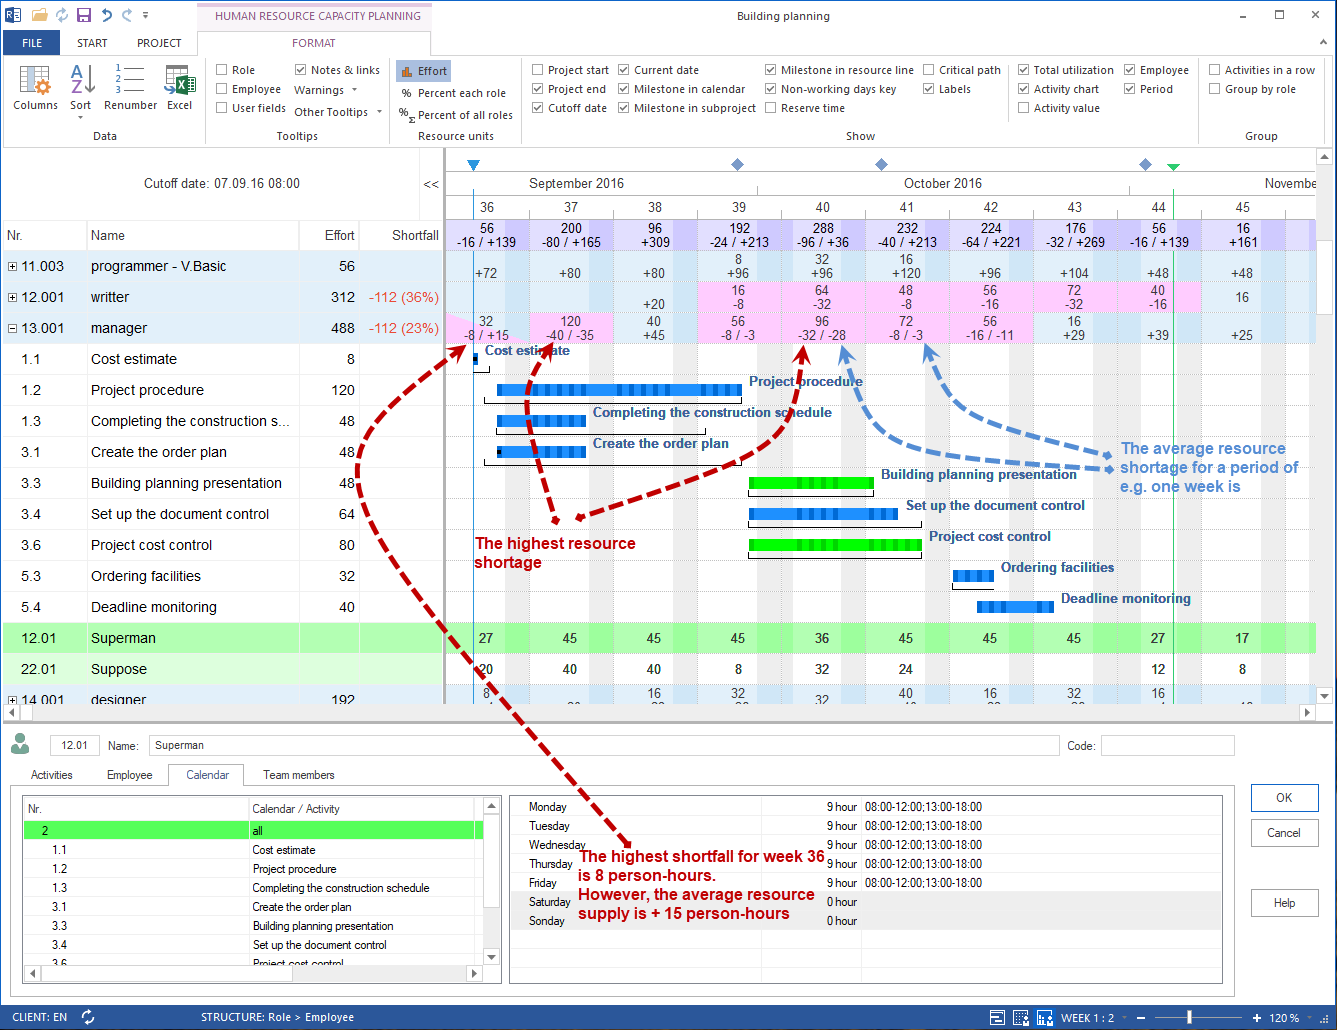
The standard variant. It shows resource demand and resource supply per professional qualification over the project period. Use it for daily capacity balancing.
Open: Start > Capacity views > Employee
Human Resource Capacity Balancing does not only show required person-hours or person-days for employees or roles. It also shows excess or shortfall (supply minus demand) and overloads.
Visual conventions:
person-hours or person-days of an employee in a task shown bold: the employee is already assigned to this task
values shown bold and red: assignment conflict, for example the same employee assigned to several tasks at the same time
In this view you can:
determine overloaded resources and the extent and causes of overloads
display working capacity by resource role
see how many hours of work are assigned to individual employees
identify remaining time for additional assignments
assign resources optimally
Human Resource Capacity Balancing, Percentage of Roles
Shows the coverage of each professional qualification as a percentage. Instead of absolute person-hours, you see to what percentage a role demand is covered by available employees.
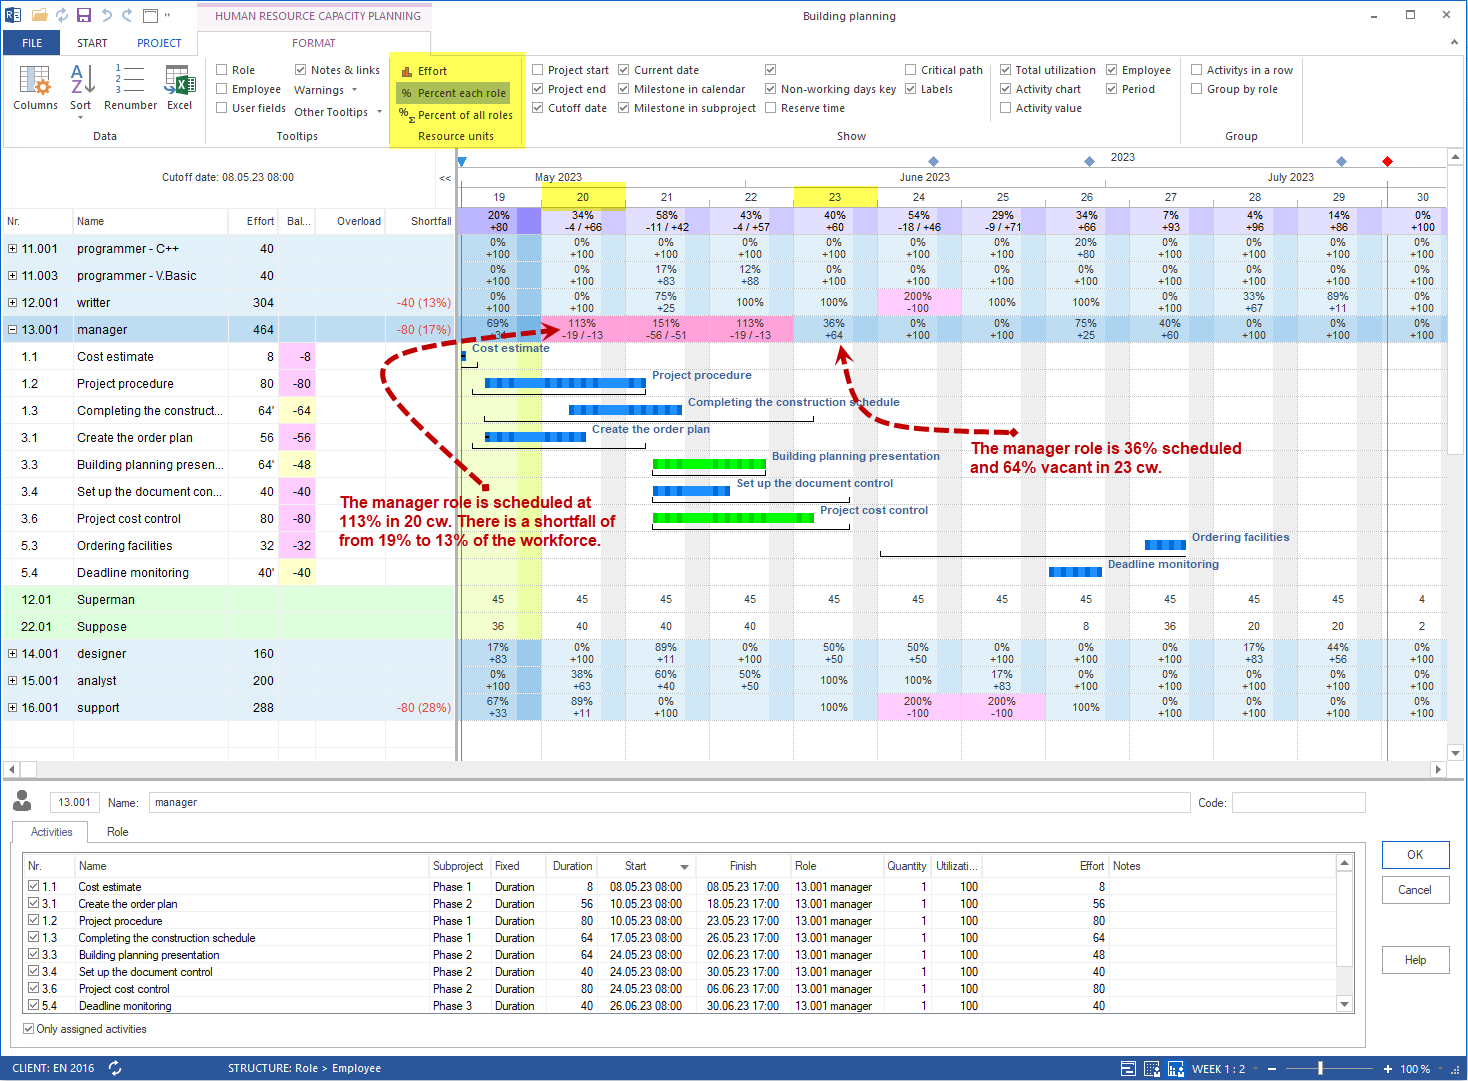
Especially useful when:
several projects run at the same time and overall utilization per qualification must be compared
you need to communicate how completely a qualification profile is covered in the resource pool
Format options:
Percentage per role shows the coverage of a professional qualification.
Percentage of all roles shows the share of a qualification in total demand across all qualifications.
Project-Specific Human Resource Capacity Balancing
Shows capacity balancing separated by project. Use it in multiproject management when several projects use the same resource pool.
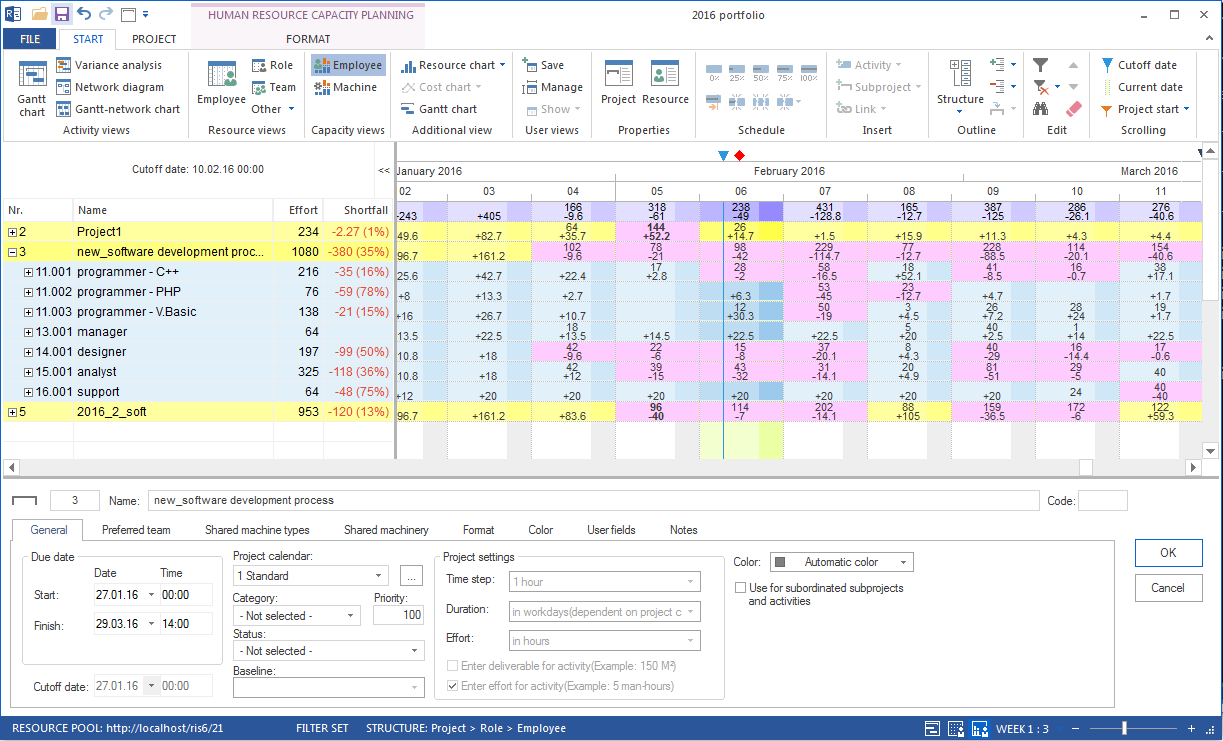
Especially useful when:
the same employees are planned in several projects
you need to identify which project causes the largest resource demand
resource decisions must be justified across projects
Variants With Additional Charts
Each capacity view can be extended with an additional chart. The additional chart appears in the lower part of the view.
Human Resource Capacity Balancing With Additional Gantt Chart
Combines capacity balancing with the Gantt chart. You see which tasks are planned in the period and which capacity they bind.
Open: Start > Additional view > Gantt chart in a capacity view.
Especially useful when:
a bottleneck must be assigned to a specific task or subproject
resource decisions should be traceable directly in the schedule
project manager and resource manager work together in one view
Human Resource Capacity Balancing With Additional Resource Diagram
Adds a resource diagram to capacity balancing. The diagram shows utilization graphically as an area chart.
Open: Start > Additional view > Resource diagram in a capacity view.
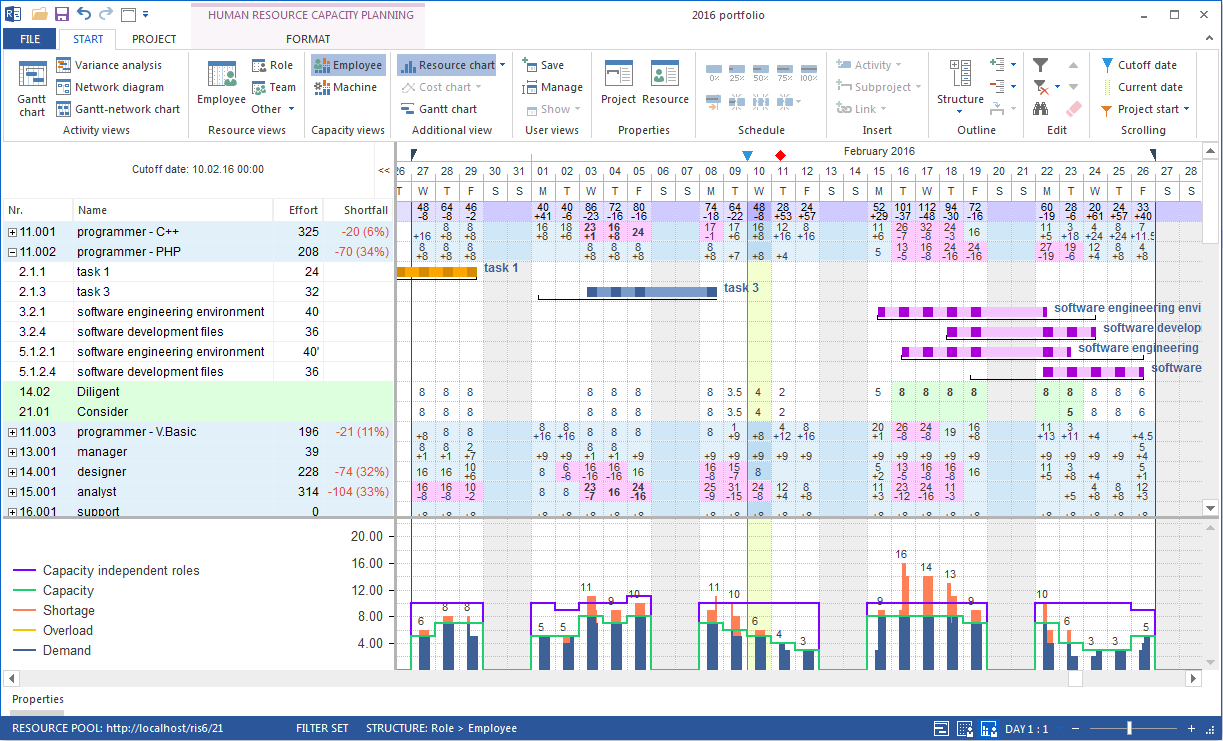
Especially useful when:
utilization peaks should be shown graphically
shortfall, overload, and free capacity should be communicated in one image
reports or presentations are prepared
Machine Variants
Machine capacity views work like employee capacity views but relate to machine types and machinery.
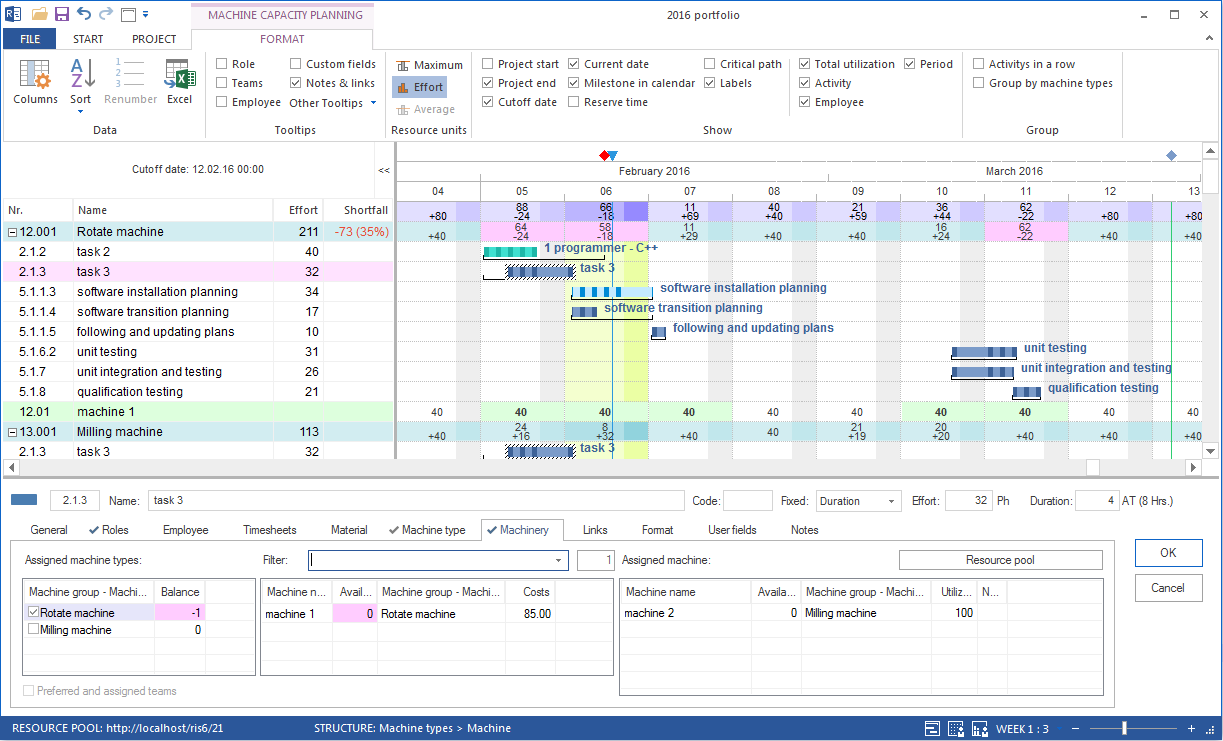
Machinery Capacity Balancing
Shows machinery demand from tasks against available machines in the machinery pool. Use it for machine-critical projects such as construction, production, or manufacturing.
Open: Start > Capacity views > Machinery
Machinery Capacity Balancing With Additional Resource Diagram
Adds a resource diagram to machinery capacity balancing and enables graphical analysis of machine demand over the project period.
Open: Start > Additional view > Resource diagram in a machinery capacity view.
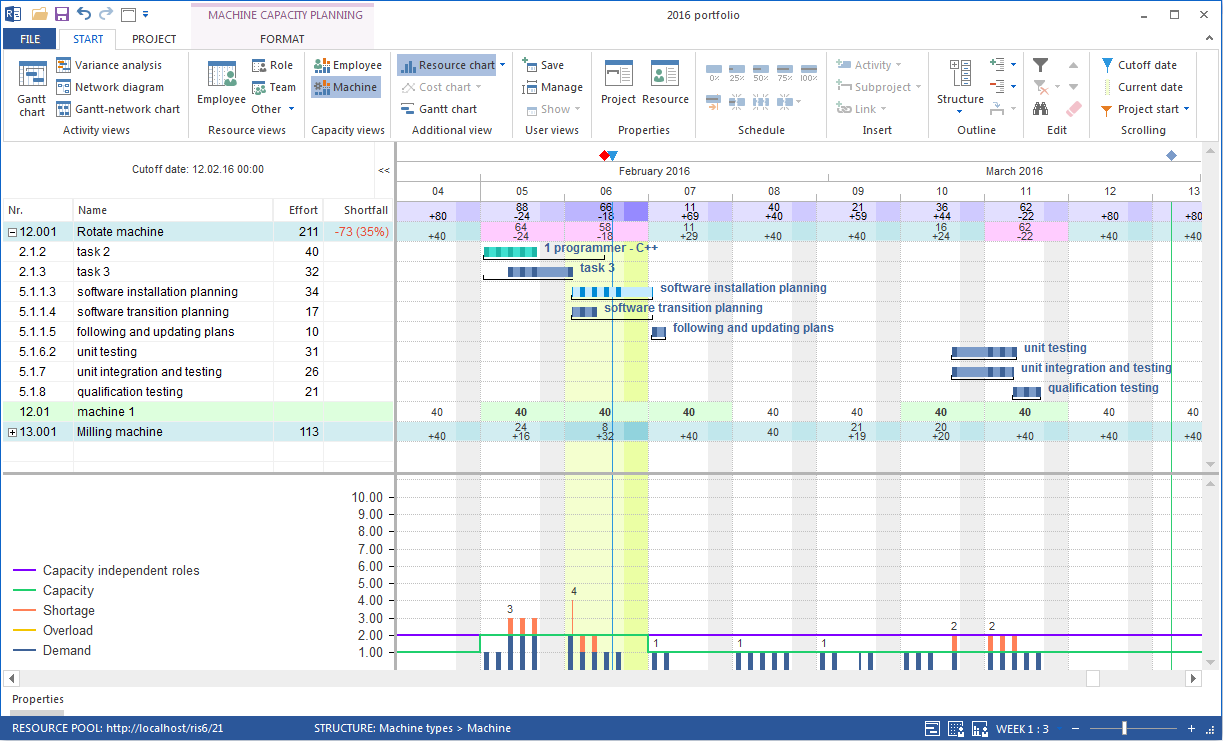
The resource diagram compares the demand for a machine group or type with available capacity:
Blue bars: capacity demand of the machine group or type per time unit, as long as demand does not exceed supply.
Green line: available number of machines per time unit.
Red bars: shortfall where demand exceeds supply.
Additional Views Overview
The three additional charts can be activated in all capacity and resource views:
Additional chart |
Description |
|---|---|
Gantt chart |
Gantt chart of tasks as lower view. Shows which tasks are planned in the current period. |
Resource diagram |
Area chart of resource utilization. Shows supply and demand as lines or areas. |
Cost diagram |
Time curve of resource costs. Shows planned costs over the project period. |
Activate: Start > Additional view > [chart type] in the relevant view.
Format Tab for Capacity Views
Each capacity view has a Format tab in the ribbon that controls the display.
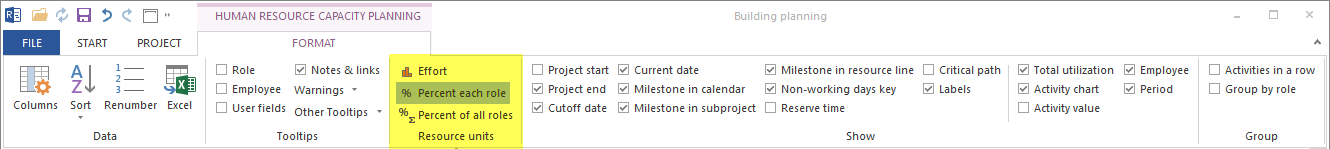
Resource units
Defines how resource effort is displayed in Human Resource Capacity Balancing:
Option |
Display |
|---|---|
Effort |
Resource demand in person-hours or person-days. Standard for daily use. |
Percentage per role |
Percentage of demand for a qualification covered by available employees. |
Percentage of all roles |
Percentage share of a qualification in total demand across all qualifications. |
Show
Option |
Effect |
|---|---|
Employee |
Shows individual employees inside their qualifications in the capacity view. |
Period |
Highlights windows in which tasks can be moved. |
Total utilization |
Summed resource utilization in the title area of the diagram. |
Task bars |
Shows task bars in resource views. |
Task numbers |
Shows resource effort per task. |
Group
Tasks in one row: condenses the display, useful with many parallel tasks
Group by employee: combines all activities of an employee, even if the employee has several qualifications or team memberships
Decision Guide: Which Variant Should You Choose?
Situation |
Recommended variant |
|---|---|
Check bottlenecks for a professional qualification |
Human Resource Capacity Balancing |
Communicate coverage of a qualification |
Human Resource Capacity Balancing, Percentage of Roles |
Several projects with a shared resource pool |
Project-specific Human Resource Capacity Balancing |
Assign a bottleneck to a task |
Human Resource Capacity Balancing + Gantt chart |
Show utilization for reports |
Human Resource Capacity Balancing + resource diagram |
Check machine demand and availability |
Machinery Capacity Balancing |