Target/Actual Comparison Views
This article describes the three target/actual comparison views, detail checks through task and subproject properties in analysis mode, and available format options.
All three views compare the current project state with a saved baseline. They are opened with Start > Activity views > Variance analysis.
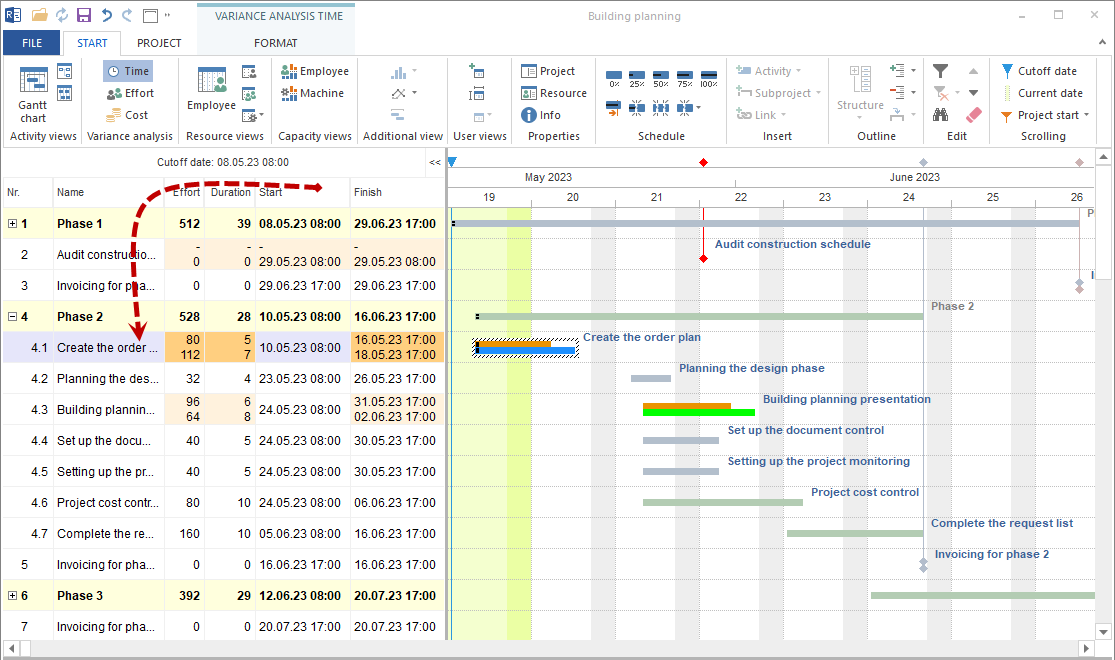
Target/Actual Comparison Time
Open: Start > Activity views > Variance analysis and use the time-focused analysis format.
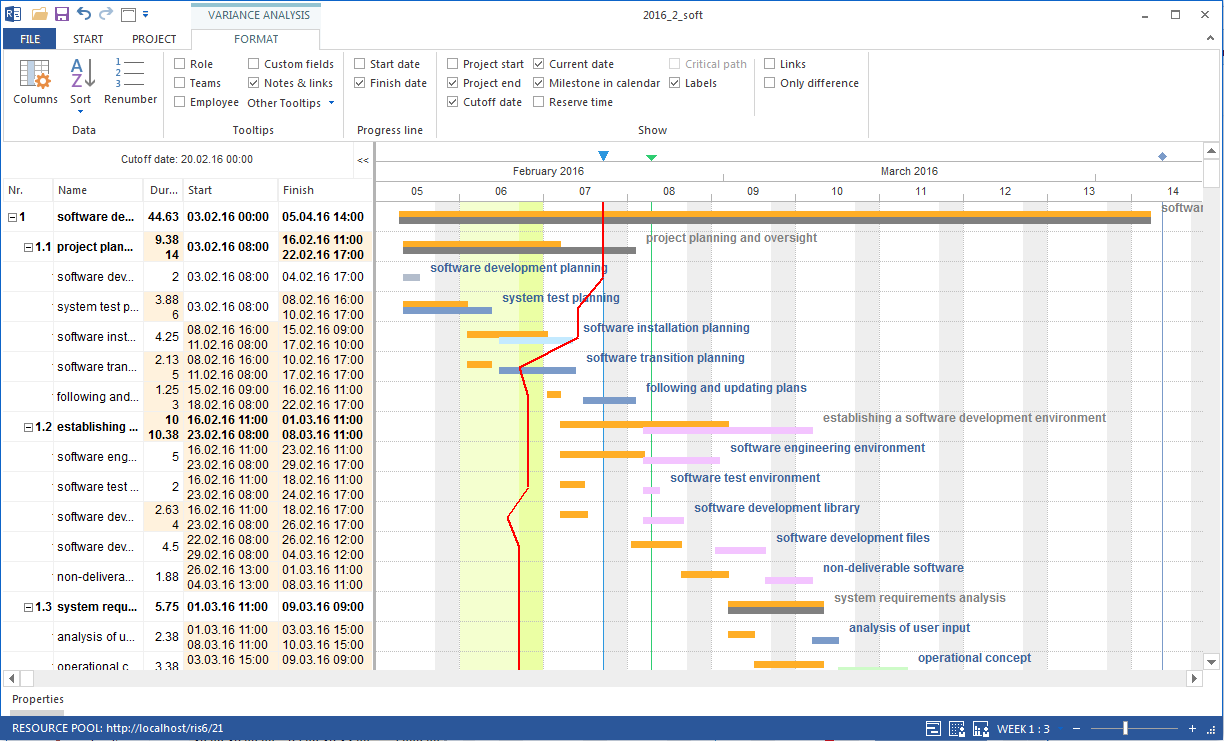
Shows date deviations between current project plan and baseline. Tasks and subprojects are shown in two rows: the first row contains planned properties, the second row current properties. Values that differ from the baseline are highlighted.
Typical use cases:
visualize the date difference between target and actual
show schedule deviations graphically
detect delays quickly with a progress line
Format options:
Progress line start dates: line based on task start dates
Progress line finish dates: line based on task finish dates
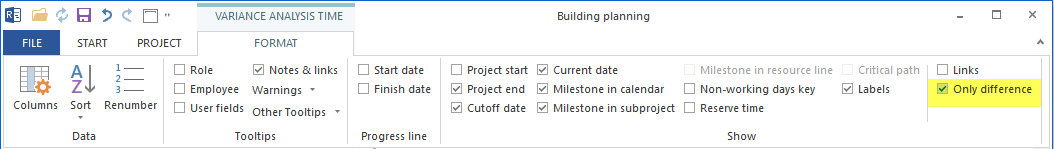
Only difference: shows only tasks and subprojects that differ from the baseline
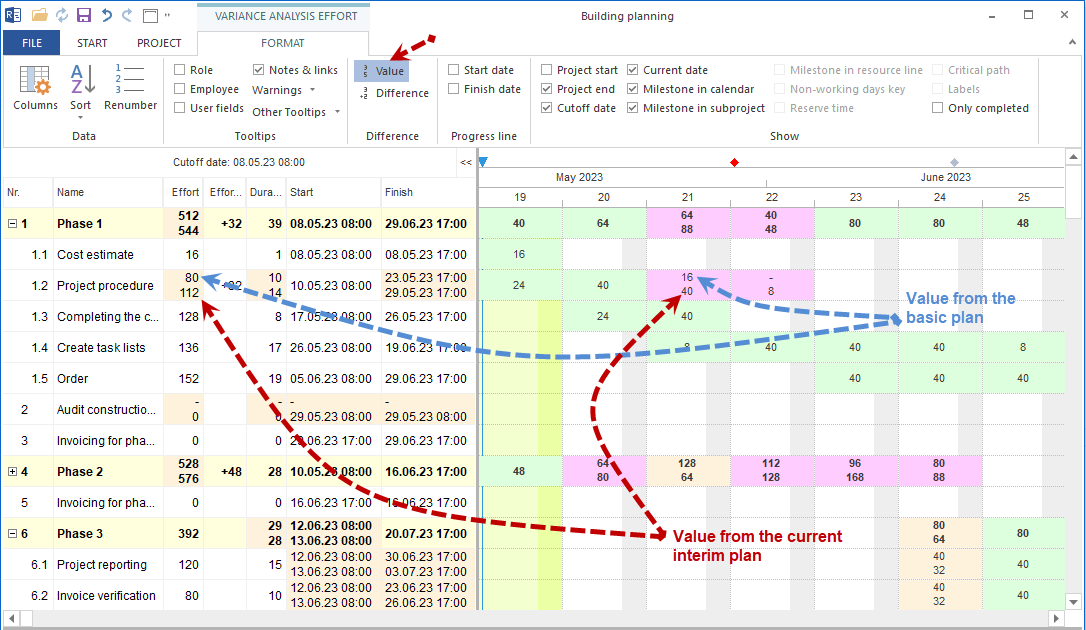
Target/Actual Comparison Effort
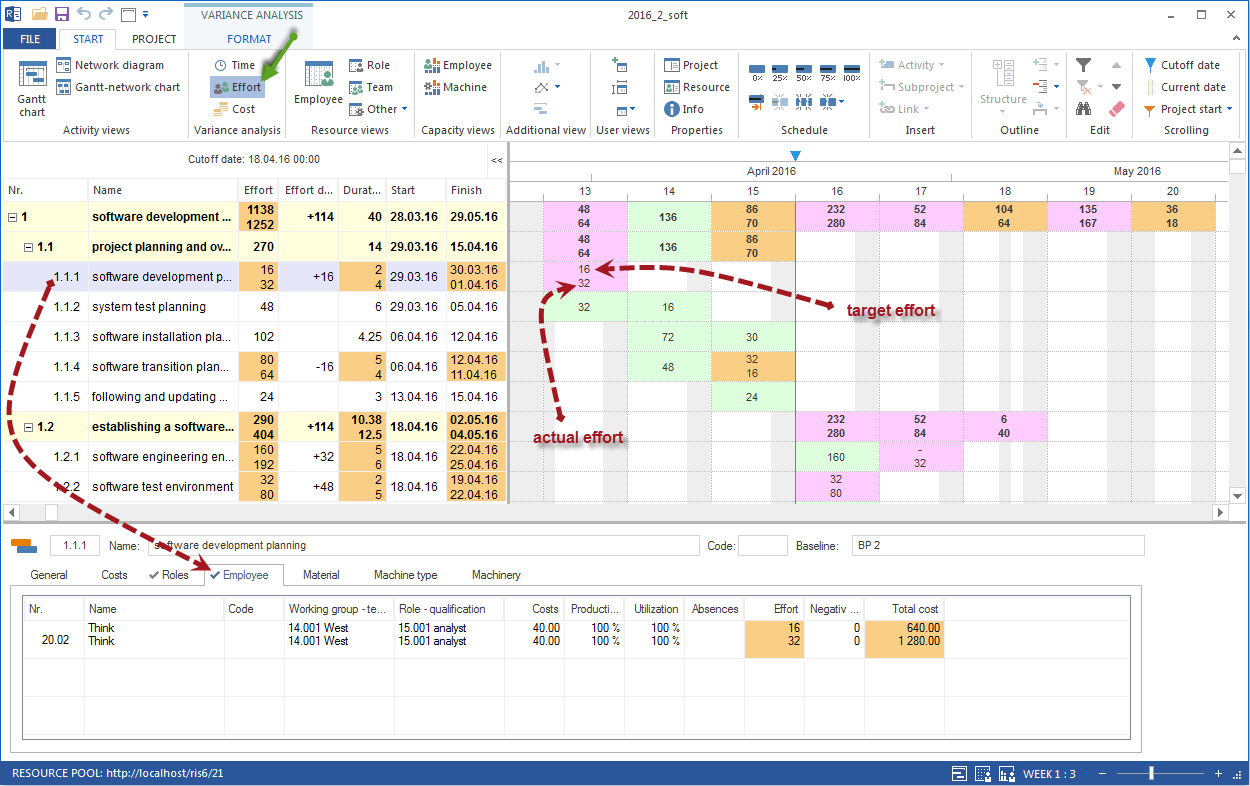
Shows the difference between effort saved in the baseline and current effort. It visualizes effort deviations per task over the time scale.
Format options:
- Value
Shows baseline effort and current effort side by side.
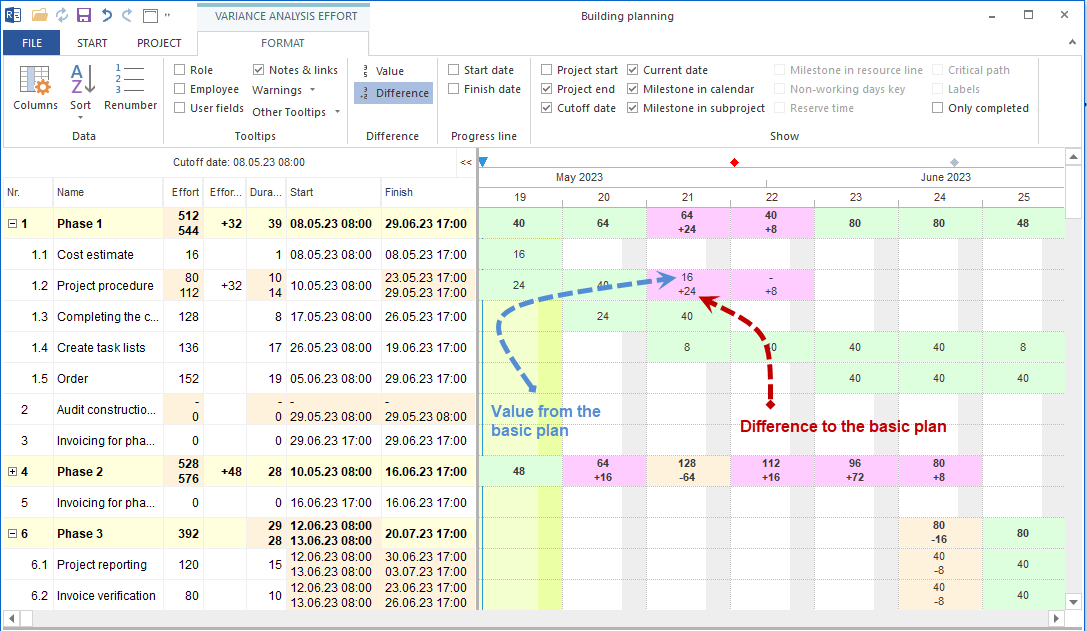
- Difference
Shows baseline effort and deviation from the baseline.
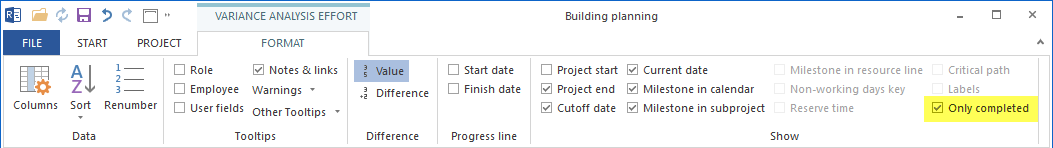
- Completed only
Compares only tasks on which work has already been performed. For a task that is 100% complete, total effort is compared. For a task that is 50% complete, current 50% effort is compared with planned 50% effort.
Target/Actual Comparison Costs
Shows the difference between current costs and costs saved in the baseline. It visualizes cost deviations over the time scale.
Format options correspond to effort comparison: value, difference, and completed only.
Task Properties in Analysis Mode
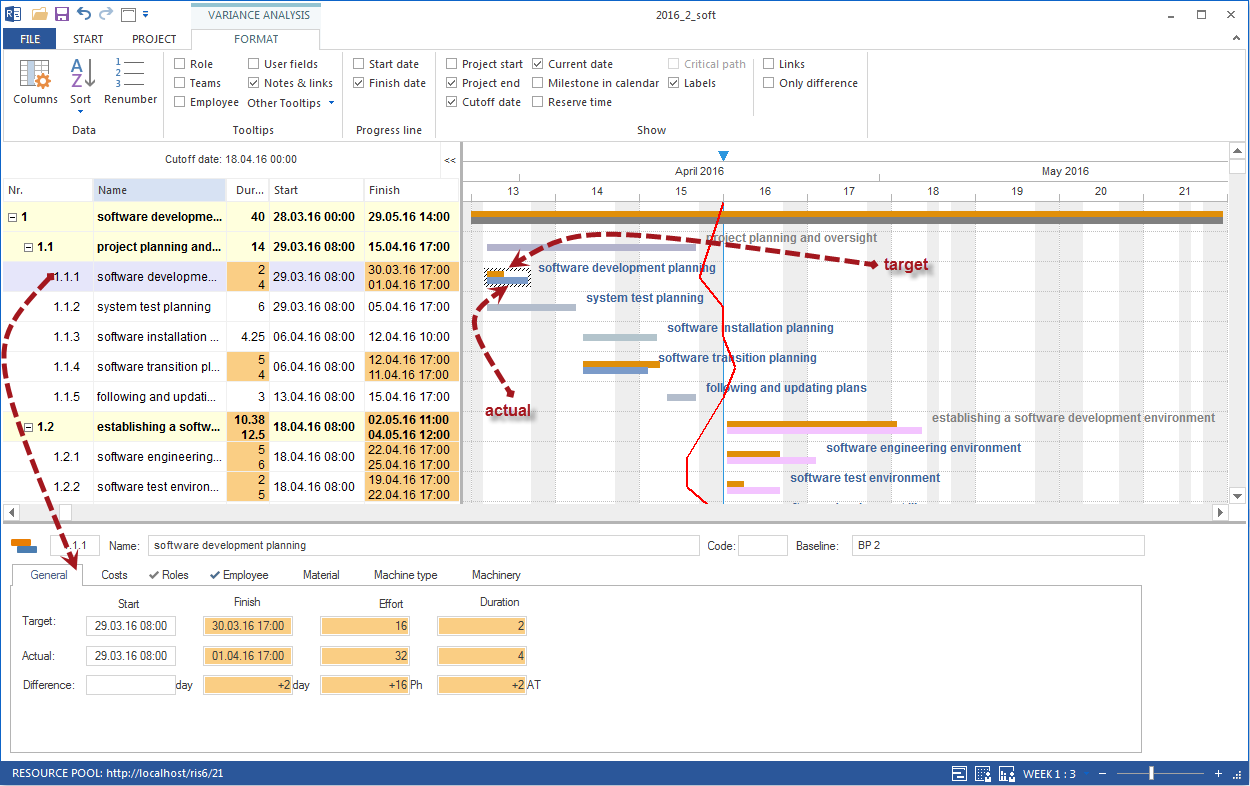
When you click a row in a target/actual comparison view, the properties window shows the deviations of this task in detail.
The deviations are visible on seven tabs:
General
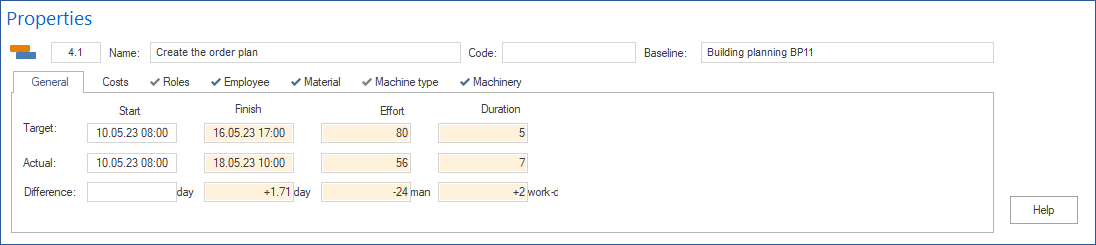
Shows deviations and summed difference between planned and current values for:
start date and finish date
effort
duration
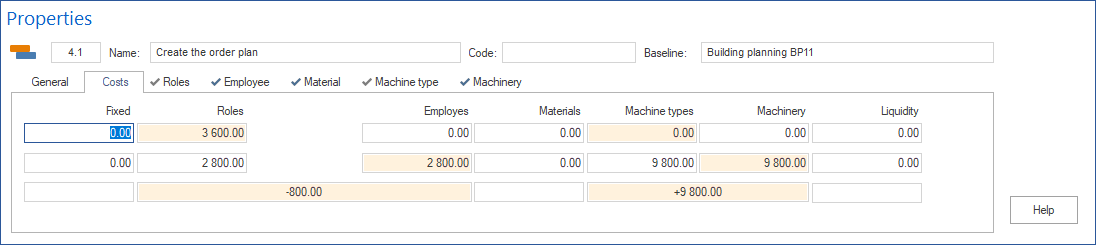
Costs
Target/actual deviations for resource costs of the task.
Roles
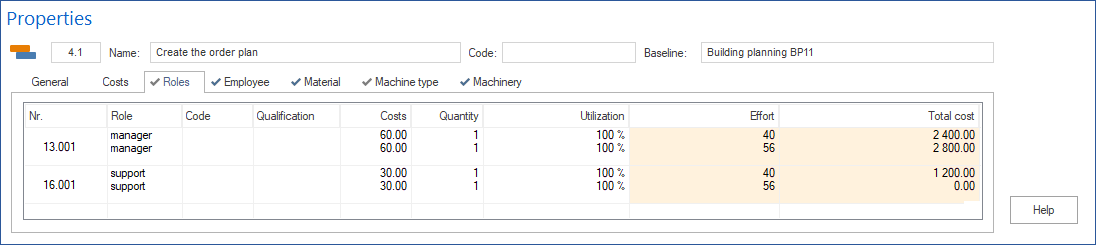
Comparison between planned and actual role demand. Shows which professional qualifications were originally planned and which are currently assigned.
Employees
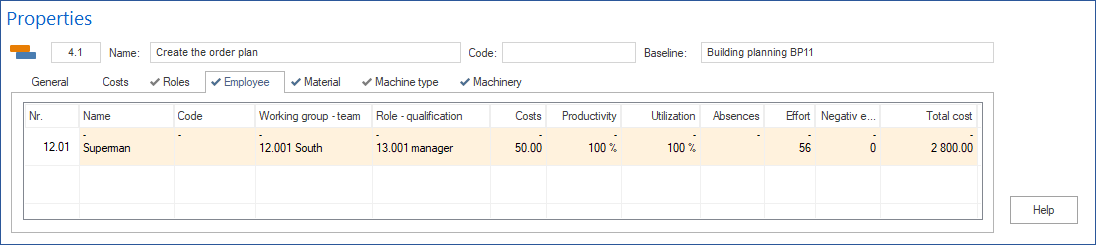
Comparison of employee assignment: originally planned employees against currently assigned employees.
Material
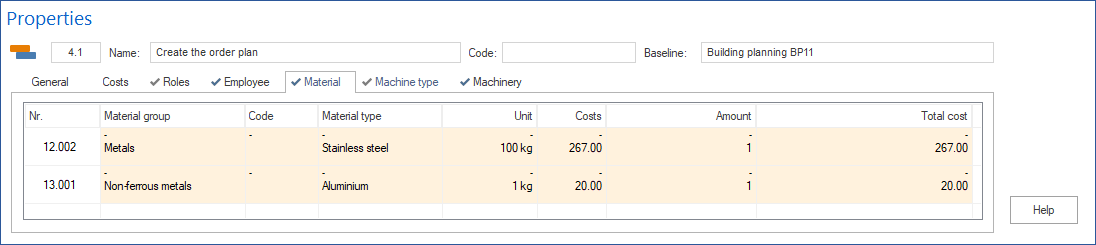
Comparison between planned and actual material use.
Machine types
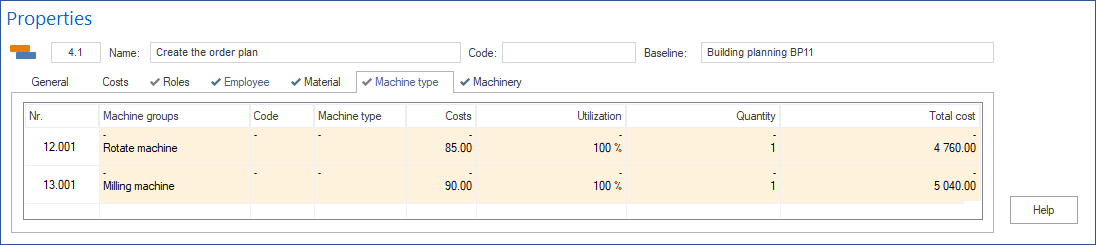
Comparison between planned and actual demand for machine types.
Machinery
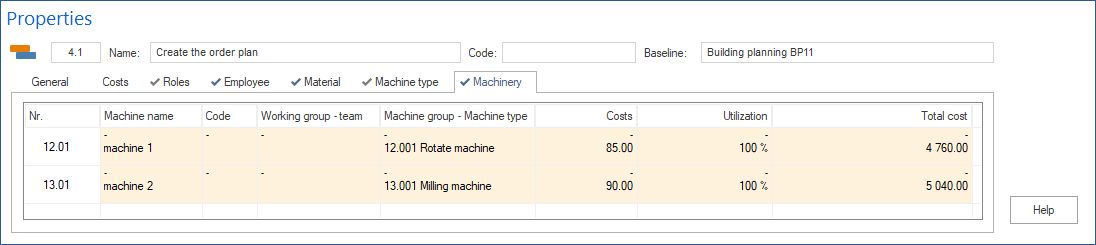
Comparison between planned and actual machinery demand.
Subproject Properties in Analysis Mode
When you click a subproject in the target/actual comparison view, the properties window shows deviations on four tabs:
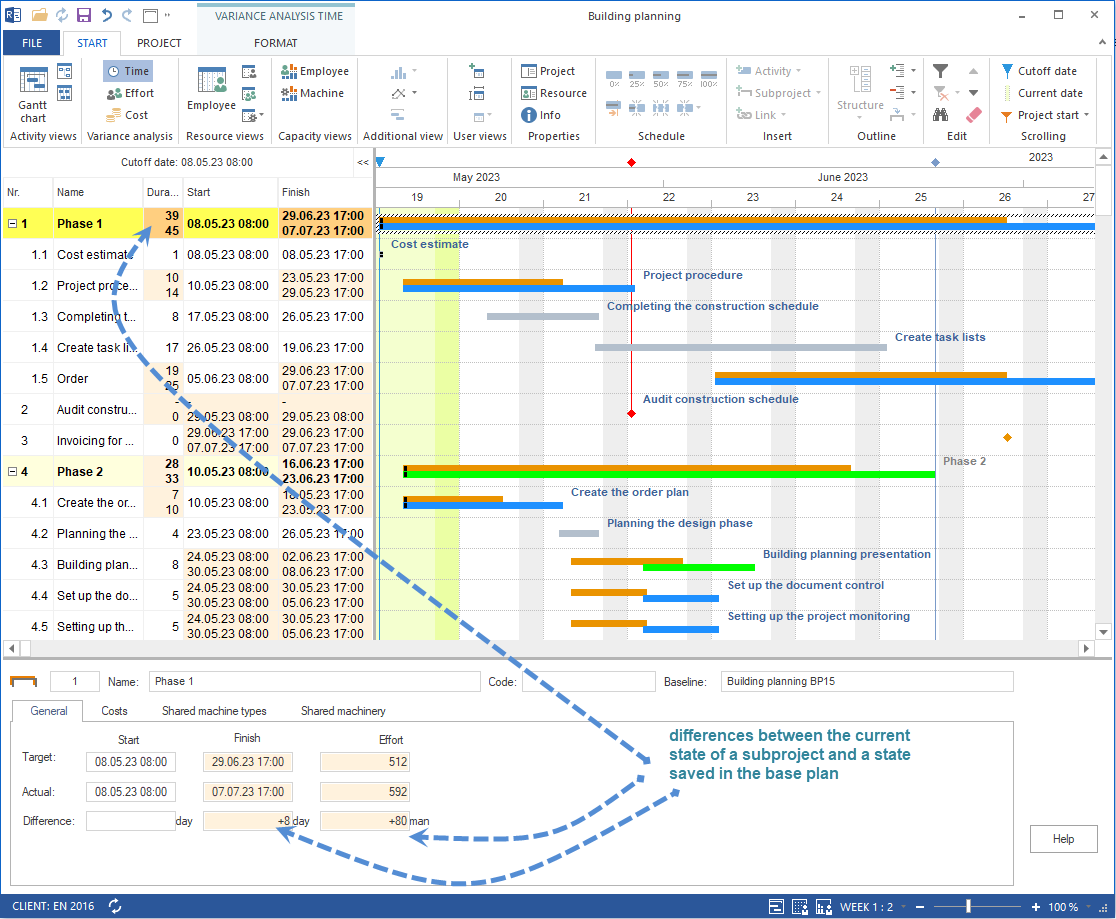
General
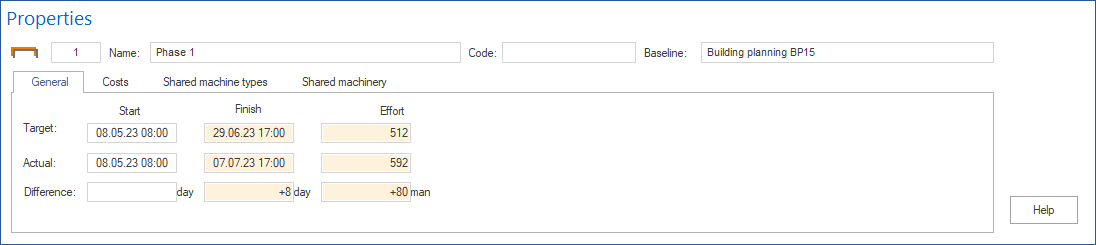
Deviations for subproject start, finish, effort, and duration.
Costs
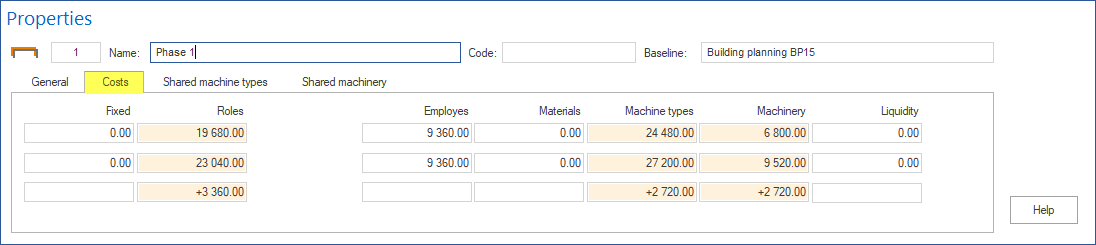
Target/actual deviations for resource costs of the subproject.
Shared machine types
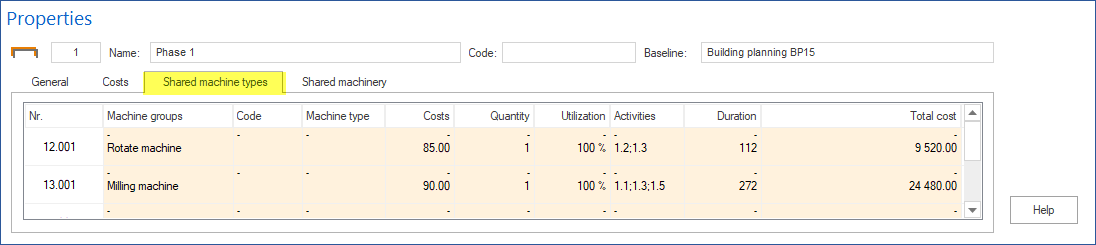
Comparison between planned and actual demand for shared machine types in the subproject.
Shared machinery
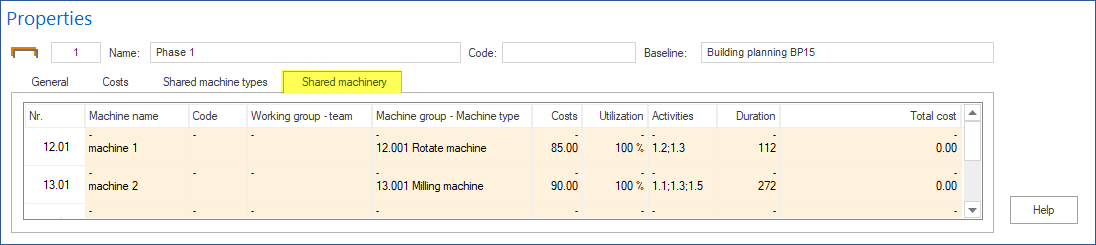
Comparison between planned and actual demand for shared machinery in the subproject.