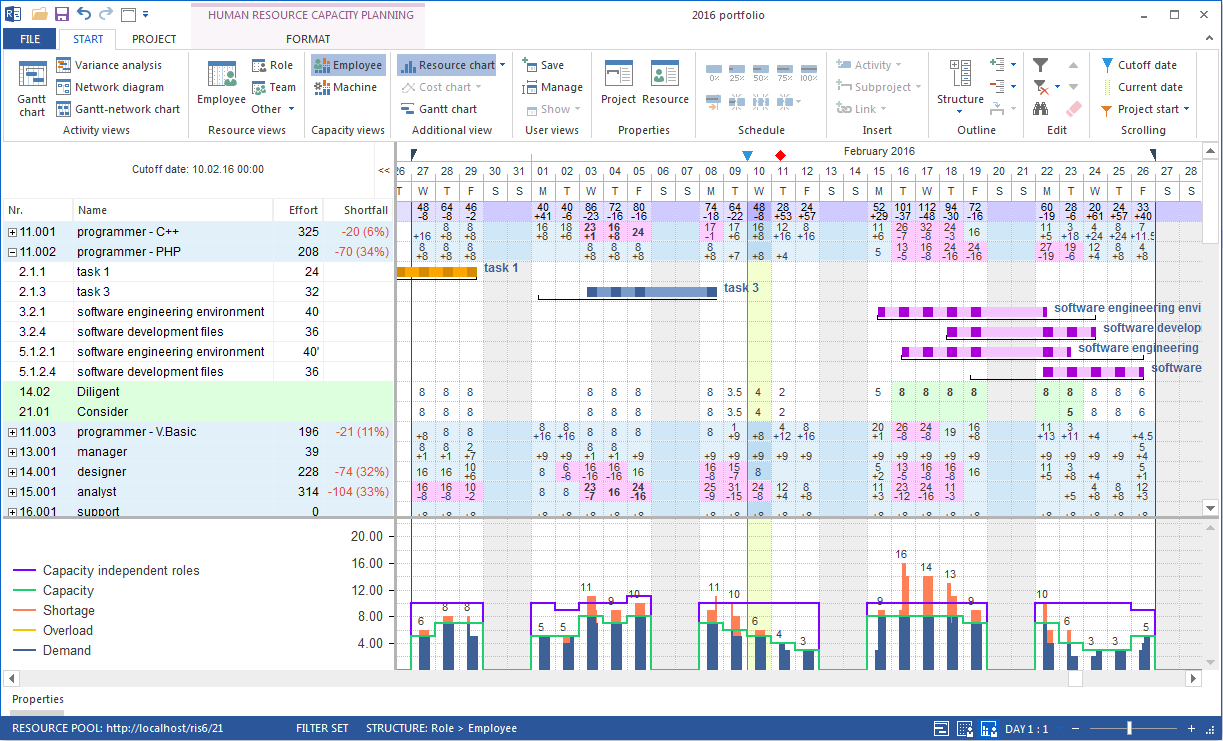
Human Resource Capacity Leveling with additional resource chart
As with other resource views you can add as an additional view the resource chart by clicking the menu item Start > Additional view > Resource chart.


Additional resource chart contrasts the demand (blue and red bars) for each of the roles / qualifications to the capacity (green line).
If you click on the required roles / qualification in the table, the chart shows the required number (per unit) of resources as bars marked blue.
The green line shows the available number (per unit) of employees.
If the green line (supply of employees) is above the blue bar (demand for employees), there is an excess of employees.
However, if the green line runs across a blue bar, a red bar shows a shortfall of employees.