Customise format views
All views have a Format tab where numerous functions for view customisation are grouped together. Depending on the format view, the available options may vary.
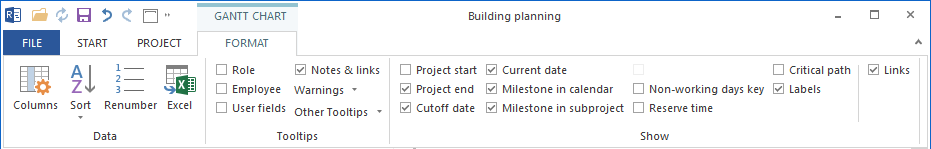
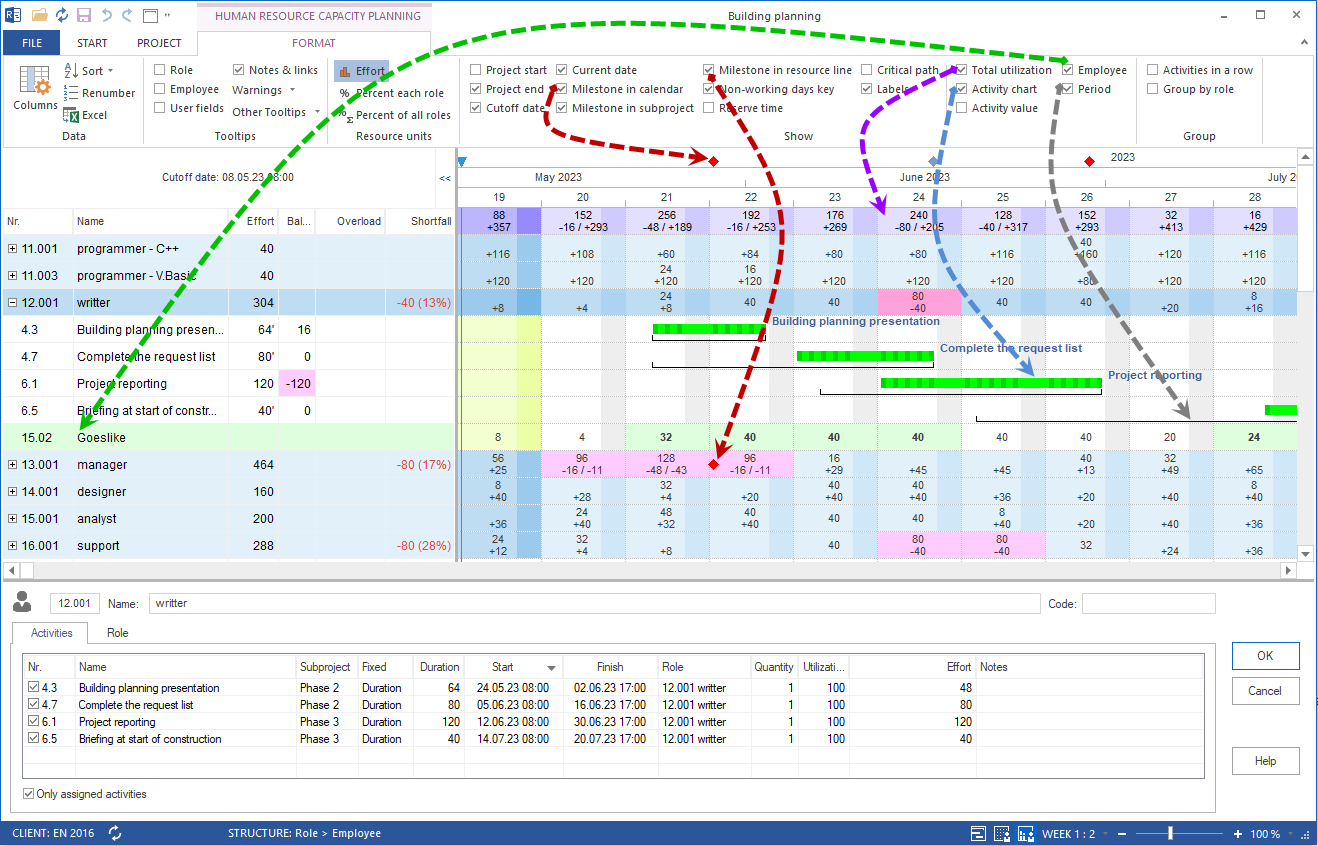
Data
Block Data provides the following functionality:
Columns Adjust the column order in the task table
Sort Sort the sequence of tasks in the project according to various criteria such as start time, name, etc.
Renumber Renumber the tasks and sub-projects after editing the plan.
Excel Export the view to MS Excel, if necessary with several levels and columns displayed in the table.
Tooltips
pear as tooltips and/or warnings when you move the cursor over an operation bar.
The following tooltips are possible:
Roles
Employees
User defined fields
Notes & Links
Other tooltips
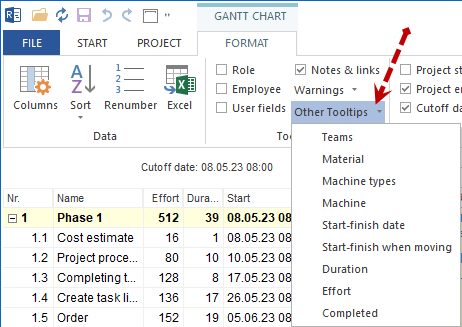
You can switch on the following warnings:
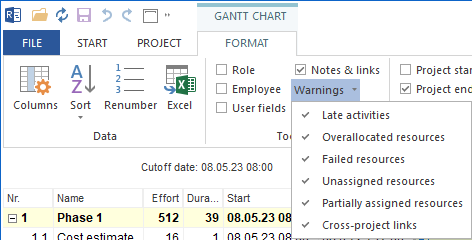
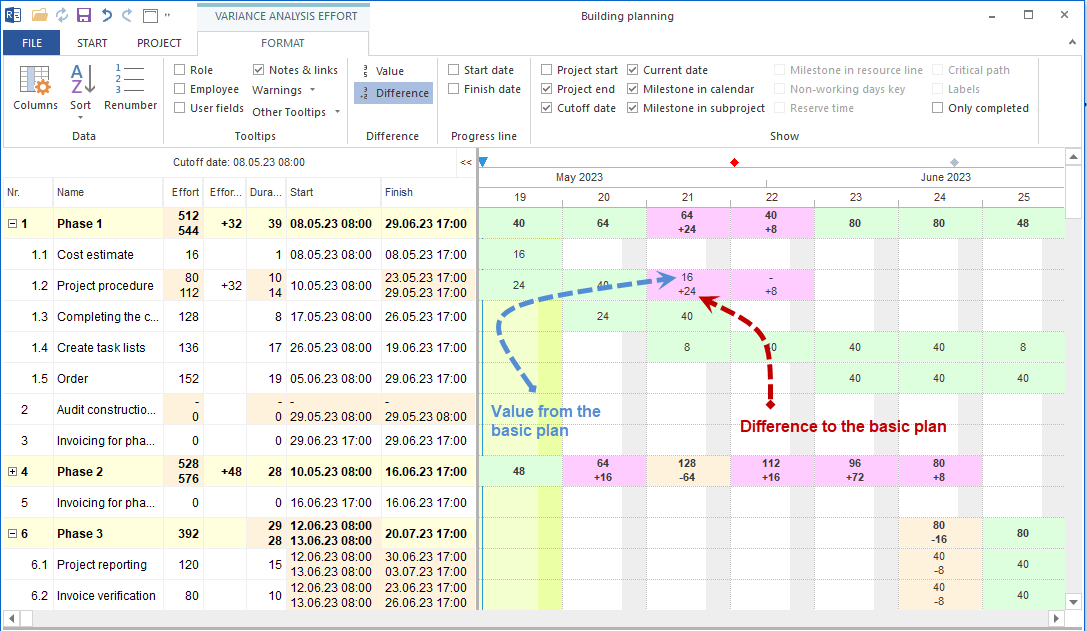
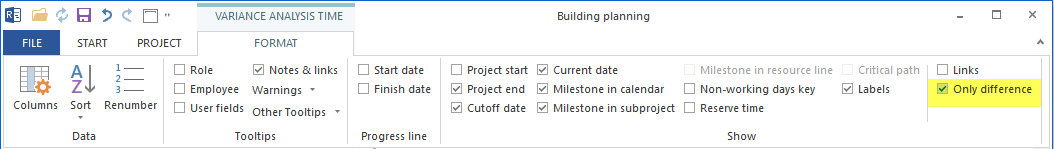
Progress line only for Variance analysis Time.
Start dates a progress line is mapped in relation to the start dates of activities
End dates a progress line is mapped in relation to the end dates of activities
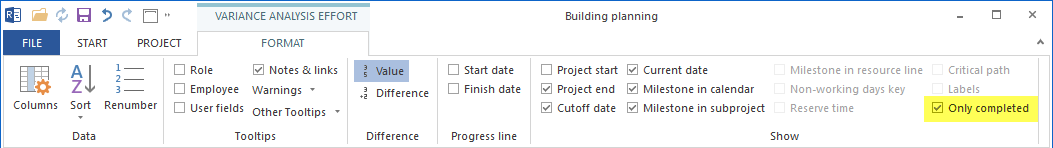
Difference for Variance analysis of Effort and Costs
Value the values from the baseline plan and the values from the current interim plan are shown
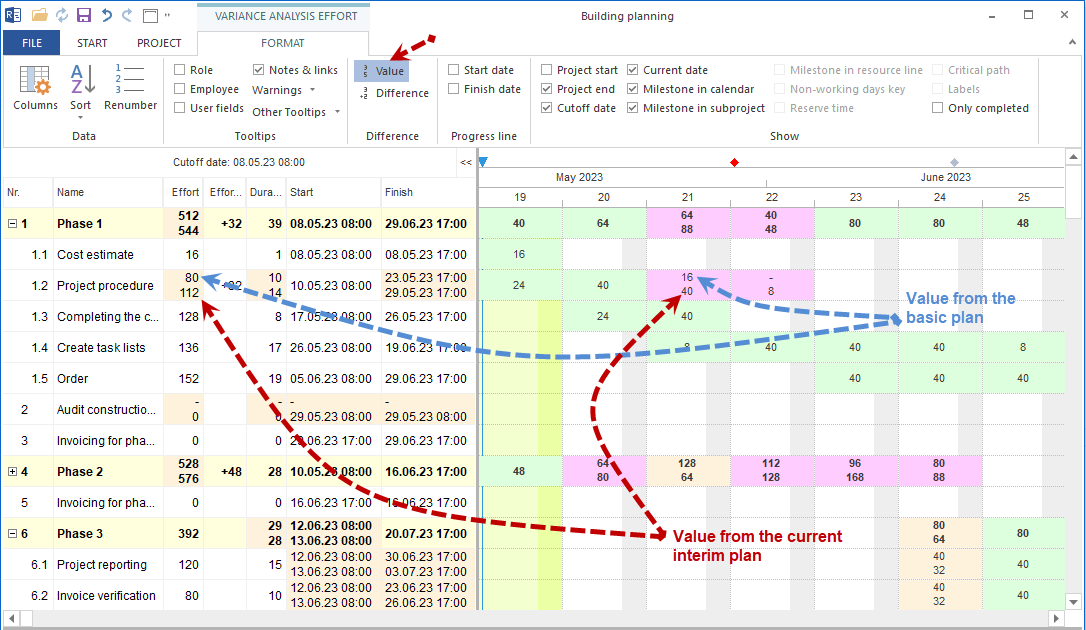
Difference the values from the basic plan and a difference to the basic plan values are calculated
Resource units
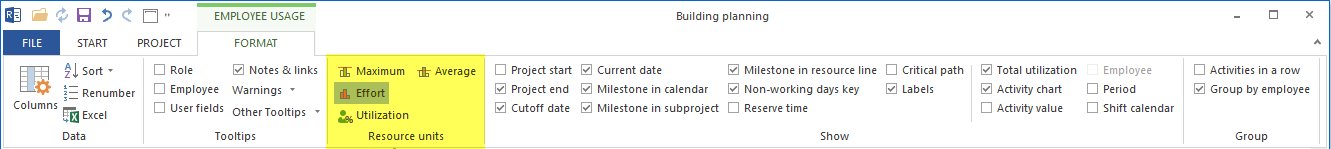
For the Employees Utilisation view, you can have the resource utilisation per time unit displayed in different variants:
Maximum - maximum number of human resources required per day, week, etc.
Average - average number of human resources required per day, week, etc.
Effort - planned effort in person-hours or person-days per day, week, etc.
Utilisation (Percentage) - enables the total utilisation of human resources by day or week to be displayed as a percentage instead of person-hours/days.
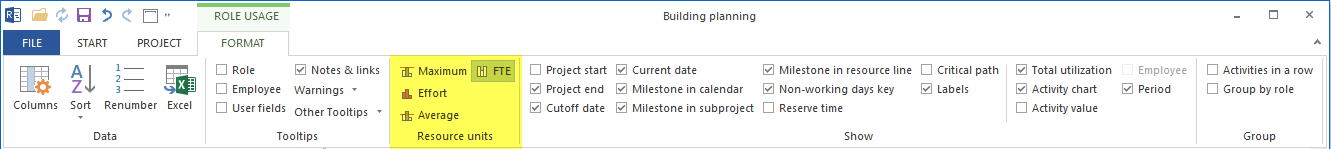
If you display the resource units at the Role Utilisation View in FTE full-time equivalent, the FTE Full Time Equivalent (FTE) option shows you the standard performance capability of a resource in a specific time period (e.g. 1 year) in a company.
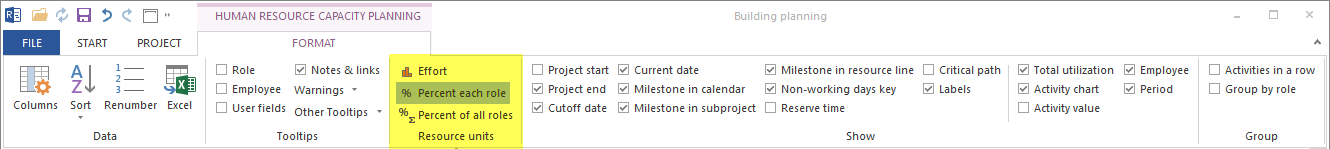
In the view Capacity Employee you can calculate a resource requirement either in resource units such as person-hours/days or in percentages according to professional roles:
Effort a required resource demand is compared with an available offer related to the project settings, e.g. person-hours or person-days.
Percentage per role shows to what percentage a demand for an occupational role is covered or undercovered with existing personnel resources.
Percentage of all roles calculates the percentage of an occupational role in relation to a demand for all qualifications.
Show
This block contains the options that allow you to refine the graphical representation of the project.
For all views except the network diagram and Gantt network chart
Project start shows a project start as an additional vertical line in the Gantt chart.
Project end shows a project end as an additional vertical line in the Gantt chart
Cutoff date shows a cutoff date as an additional vertical line in the Gantt chart
Current date shows a period in the Gantt chart with a background colour where the current date is located
Milestone in calendar Milestones are shown/hidden at the top of the calendar bar.
Milestone in subproject/project Milestones are shown/hidden on a collapsed subproject bar.
Non-working days key Designations for non-working days, e.g. U for holiday, are shown/hidden in the Gantt chart.
Reserve time shows earliest and latest possible operation items
Critical path shows in red colour operations that belong to the critical path.
Labels the labels are shown/hidden in the Gantt chart
Links show/hide the links between operations
For all Resource views
Milestone in resource line Milestones are shown/hidden on a resource line, provided that the resources are assigned to the milestones.
Total utilization shows the summed resource utilisation per view in the title area of the chart
Activity chart the activities bars are displayed in resource views
Activity value the effort values for the activities are displayed in resource views
Employee the human resources can be seen in a capacity view
Period shows the free time periods within which you can move the activities.
For Employee view
Shift calendar The shift calendars assigned to the employees are displayed with background colour.
For Variance analysis Time view
Only difference only those activities and sub-projects are displayed that have a difference to the selected base plan.
For Variance analysis of Effort and Costs view
Only completed only the effort or cost values are compared for the activities where the work done, e.g. the completed percentage or completed effort is higher than zero. If an activity is 100% complete, the current effort or cost is compared with the planned values for the whole activity.
However, if a task is only partially completed, e.g. 50%, then the current 50% effort is compared to the planned 50% effort of the task.
Group
The option Activities in one row can make the graphical representation look compact. In doing so, it might be useful to switch off the Labels from the Show block.
The option Group by employees is useful when a staff member may have several professional roles or belong to different work groups and you want to map all his activities together.