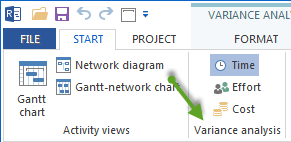
Variance analysis time
Variance analysis time shows you the temporal difference between the current project plan and one of the baselines.
Click on Start > Variance analysis > Time
Time difference
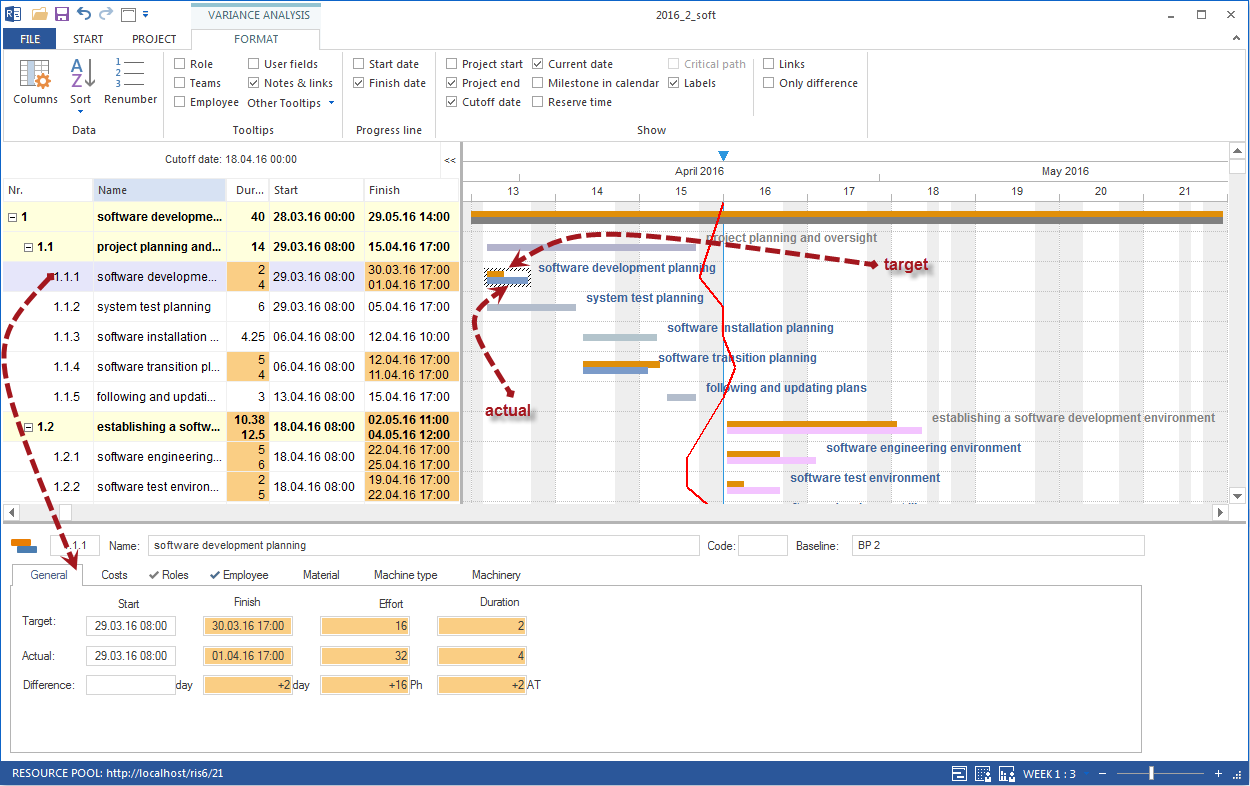
Application of Variance analysis time:
Visualization of the temporal difference between target and actual.
Graphical representation of schedule deviations.
Rapid detection of time deviations from the plan and fact by means of a progress line.
Note:
The first row lists the properties of the scheduled activities and subprojects, while the second row lists the properties of the required activities and subprojects. Parameter deviating from the baseline are marked in yellow.